
- All Data Presentations
- 3D Chart Example
- 3D Chart Maker
- Bar Chart (Divided)
- Bar Chart Maker
- Bar Chart (Percentage)
- Bar Chart (Range)
- Beach Profile Maker
- Bi-Polar Graphs
- Bihistogram Creator
- Bi-Polar Chart Maker
- Box Plot Creator
- Cailleux Roundness
- Choropleth Maps
- Coding Analysis
- Cross Section Maker
- Cumulative Frequency
- Divided Bar Charts
- Donut Chart Maker
- Histogram Creator
- Line Chart Maker

Line of Best Fit
- Kite Data Entity Example
- Kites Data Entity Maker
- Kites Species Creator
- Kites Species Example
- Map Cross Section Maker
- Percentage Bar Charts
- Pie Chart Maker
- Pie Chart Maker Example
- Polar Area Chart Maker
- Polar Area Example
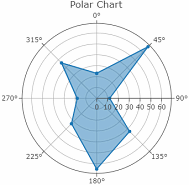
- Polar Chart Example
- Polar Chart Maker
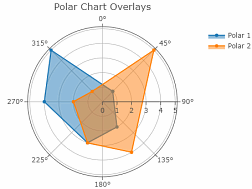
- Polar Overlays Example
- Polar Overlays Maker
- Polar Scatter Maker
- Proportional Circles
- Proportional Circle Maker
Radar Charts
- Radar Chart Maker
Radar Chart Overlays
- Range Bar Charts
River Cross Sections
- Rose Diagram Example
- Rose Diagram Maker
- Sand Dune Profiles
Scatter Graphs
- Scatter Graph Maker
- Slope Profile Example
- Slope Profile Maker
- Stacked Bar Chart Maker
- Stacked Bar Example
Triangular Graphs
- Triangular Graph Example
- Triangular Graph Maker
- Word Cloud Example
- Word Cloud Maker
- Beach Profiles
- Lichenometry
- Map Reading
- River Discharge
- Gentrification
- Mapping Techniques
- Slope Steepness
- Minimum Sample Size
- Optimum Quadrat Size
- Random Numbers
- Random Sampling
- Sampling Problems
- Sample Size
- Urban Sampling
- Box Plot Maker
- Beach Volume
- Hydraulic Radius
- Mann Whitney U Test
- Manning's n
- Nearest Neighbour
- River Cross Section
- Scatter Graph Creator
- Simpson's Diversity Index
- Slope Steepness Index
- Spearman's Rank
- Spearman's Calculator
- Standard Deviation
- Statistical Methods
- Wetted Perimeter
Geography Data Presentation Techniques and Methods
Many of the most appropriate types of data presentation techniques used to visualise raw geographical data are shown on this page. We provide the tools to create and save the images shown and these are quick and easy to use, free with no account or log-in required.
Besides creating images, the geography data presentation tools have many mathematical functions. These include the calculation of cross sectional area for beach profiles and river cross sections, trend lines for scatter graphs and standard deviation for box plots.
Simply open the calculator for your chosen technique, enter your data, adjust titles and data labels. An image of your data presentation and the calculations used to create it are then instantly ready for download.
Percentage or Divided Bar Charts
Stacked bar charts, min-max range floating bar charts, beach profiles (using slope angle data), beach profiles (using height change data).
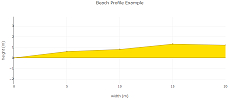
Beach Profiles (using absolute height data)

BiHistograms
Bi-polar charts, box plots or box and whisker charts (horizontal), box plots (vertical).
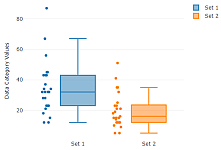
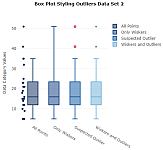
Box Plots (Outliers)
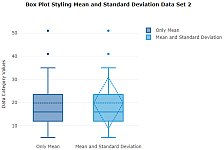
Box Plots (Mean and Standard Deviation)
Cumulative Frequency Chart
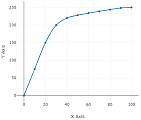
Donut (Doughnut) Charts
Kite diagrams (any data entities), kite diagrams (species abundance), line charts.
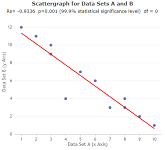
Map Cross Sections
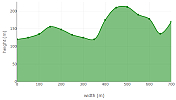
Polar Area Charts
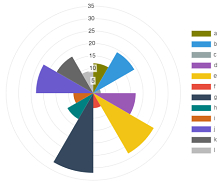
Polar Charts
Polar Chart Overlays
Polar Scatter Charts
Proportional circles chart.
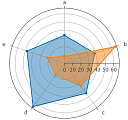
Rose Diagrams
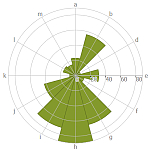
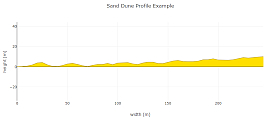
Sand Dune Profiles (using slope angle data)
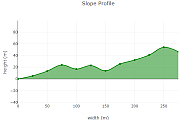
Slope Profiles (using slope angle data)
Word Clouds


A Level Geography NEA: Everything you need to know
- Study Skills

- Share Article
What is the A Level Geography NEA?
How do you structure the geography nea, concluding remarks.
For Year 12 students, the last half term of the academic year is typically a time for reflection and taking stock of what they have learned so far. However, for geography students, this time is one of the busiest and most intense. The reason? The Geography NEA , which often kicks off after the external examination period in schools, demanding significant time and effort to complete.
NEA stands for non-examined assessment . It’s an important aspect of A Level Geography, allowing students to apply the theories they have learned and create a substantial enquiry project using both primary and secondary research. The Geography NEA is divided into manageable sections which will be assessed by your teachers at school or college.
The NEA provides an opportunity to do a deep dive into an aspect of geography that interests you the most. Your NEA must be linked to a taught aspect of the A Level Geography specification you are studying at your centre.
Each exam board provides a range of example titles and enquiries in their assessment specifications. Additionally, your centre will give you examples of projects completed by previous students. While these examples can serve as a guide, it’s important that you come up with your own enquiry question before starting your NEA.
Before starting your NEA enquiry, you will write a proposal that will be submitted to your supervisor (teacher). The proposal will include the following sections:
- Investigation title
- How the title links to the specification content
- Planned investigation hypothesis or question/sub-questions
- Investigation focus
- Planned methodology
Once you have completed your proposal form, your supervisor will review it. If the proposal is approved, you can begin your project. If it is not approved, your supervisor will provide feedback on what needs to be changed, and you will need to redraft the proposal form.

When it comes to the teacher assessment phase, each exam board has split the NEA into different sections. However, the general structure of the NEA written report is similar across the exam boards. Each completed Geography NEA should include:
- Introduction
- Literature review
- Methodology (including risk assessment and ethical considerations)
- Data presentation
- Data analysis
How do you write the NEA introduction?
The NEA introduction allows you to outline your enquiry to the reader and help them understand where and why you will be carrying out your investigation. This section should clearly state your hypotheses and key questions and provide a rationale for why you are asking these questions .
In your introduction, you should include the location details of your investigation. This gives you an early opportunity to use GIS (Geography Information Systems) by using a range of maps to demonstrate the study location.
What is the NEA literature review?
A literature review means reading geography books, websites, and journals for your NEA and referring to these sources in your report to demonstrate your understanding of geography concepts. Your fieldwork will help you determine if these ideas hold true in your chosen area. When conducting the literature review, you will need to use a range of materials that are academically sound and from reputable sources .
The research you conduct during the literature review should be referenced throughout your enquiry , including in your data analysis and conclusions. This will help you to either prove or disprove your hypotheses and key questions.

How do you write the NEA methodology?
The methodology is the part of the Geography NEA that outlines:
- what data you collected or are going to collect
- how you collected or are going to collect the data
- why you collected or are going to collect the data
The methodology can be written in either the past or future tense, depending on when you are writing it. If you have already completed your data collection, write it in the past tense. If you are going to complete it, write it in the future tense. I would suggest writing the methodology after completing your data collection . This approach will provide you with a greater understanding of the methods and the reasons for collecting that specific data.
The methodology should be written in a way that allows others to replicate your NEA in the future. It should include details such as:
- Name of method
- Description of method
- Type of data collected
- Sampling techniques used
- Justification of method – this is key to achieving the highest marks available
- Risk assessment
I recommend organising the methodology in a table with the above list as column titles. This will ensure that all key aspects are covered, giving you the best chance of achieving the highest marks.
How do you present and analyse data in the NEA?
Once you have collected your data, it’s time to present it. You can use a range of data presentation methods. Try to choose the most suitable ones to make your results easy to understand. To achieve the top marks in your Geography NEA, you need to use a wide variety of data presentation methods . I recommend looking at PMT’s guide to data presentation before you begin:
- AQA data presentation guide
- OCR data presentation guide
- Edexcel data presentation guide
- WJEC data presentation guide
This is another opportunity for you to utilise GIS . Using GIS allows you to incorporate a location element into your data presentation, which can help you achieve the highest marks in this section.

Once you have presented and transformed your raw data into a usable format, you can proceed with the analysis. Data analysis is a crucial part of your Geography NEA enquiry, as it will enable you to draw conclusions and ultimately answer your key questions and hypotheses .
If you have quantitative data, it’s important to carry out statistical tests to demonstrate the reliability of your data and conclusions. You can find examples and full walkthroughs in the PMT NEA guides to help you.
At this point, you should be ready to write about your results from your data presentation and critically analyse the data. When analysing your data, ensure that you connect it to your hypotheses or questions . Start by discussing what your data reveals about your subject, such as patterns or common opinions. In addition to overall trends, use specific numbers and quotes. You can also use this opportunity to manipulate some of the data. Thoroughly examine your data and don’t ignore any unusual points that might disprove your hypotheses.
During your analysis, you can comment on the accuracy of your data to strengthen your conclusions. For example, you could comment on the precision of your graphs to show that your data captures all trends. Additionally, you should discuss how well your data represents the study area , especially if multiple investigation sites were used. Explain the appearance of data patterns using geographical theories, and link this to your literature review . This will show that your understanding of geography has deepened through your investigation.
How do you write the NEA conclusion?
The conclusion of your Geography NEA is where you essentially answer your key questions using the data you have collected and the critical analysis you have conducted.
Start by answering each of your key questions individually, summarising the relevant analysis to directly match each question. Once you have answered the key questions, use these to address your overall hypotheses and ultimately summarise your entire enquiry, tying together the main findings and insights.
How do you write the NEA evaluation?
The final part of the NEA enquiry is the evaluation. This is generally poorly completed because it’s the final stage and candidates often run out of time and rush this section.
The evaluation is an opportunity for you to reflect on the process and comment on the reliability of your processes and results . You can discuss your methods and consider how you could improve them for more reliable results.

How long should the NEA be?
The guidance states that the A Level Geography NEA should be between 3000 and 4000 words . However, you will not be penalised if you go over this. I suggest that you do not go over the recommended word count significantly, as this will mean that you have not been writing concisely and may impact your ability to achieve the highest marks.
How many marks is the NEA worth?
The number of marks the NEA is worth varies depending on the specific exam board. For the precise mark allocation, check with your school or college.
Which section of the NEA is worth the most marks?
The data analysis section of the NEA is typically worth the most marks.
What are the grade boundaries for the NEA?
The NEA is worth 20% of your total grade for A Level Geography. Each year, the grade boundaries for the NEA vary because they are determined after all exam papers and NEAs have been assessed and analysed by the exam board.
When is the A Level Geography NEA deadline?
The deadline for the Geography NEA can vary depending on your school and exam board. Generally, the NEA is expected to be completed and submitted during the final term of Year 12 or early in Year 13, well before the final A Level exams in the summer. Starting early and managing your time effectively can help ensure you meet the deadline without any last-minute stress.
How do I get an A* in the A Level Geography NEA?
To succeed in your NEA, I would always recommend choosing a topic that genuinely interests you . This will help you stay engaged in the project, allowing you to write detailed and thorough responses and engage fully in the enquiry.
To achieve an A*, you need to consistently aim for the highest band in each element of the enquiry. I would suggest that all candidates familiarise themselves with the NEA mark scheme and use it as a guide for their writing. You also need to ensure you write succinctly and accurately throughout your project, as this will help you access the highest marks.
The NEA is a significant component of your overall A Level Geography grade, providing you with an opportunity to apply your theoretical knowledge in a practical context. The NEA demands careful planning, thorough research, and detailed analysis. By understanding the structure and requirements of each section, you can approach your Geography NEA methodically and confidently, and produce a thorough and insightful project. Good luck!
Looking for more help with A Level Geography? Check out our guide to mastering A Level Geography 20-mark essay questions !

Dave is a qualified teacher with 10 years of experience teaching GCSE and A Level Geography. He has worked as an assistant faculty leader for Humanities and a professional mentor for new and trainee teachers. He has also been involved with the supervision and guidance of NEAs. Dave currently works in higher education and trains geography teachers across the North West of England. He is also a tutor at PMT Education , with experience running highly successful geography courses .
Recent Posts

How to draw reaction mechanisms in A Level Chemistry
Mastering organic reaction mechanisms is a key part of A Level Chemistry, and it all starts with understanding how to draw them. In this article, chemistry teacher Dan breaks down the different types of mechanisms you'll need to know, from nucleophilic substitution to electrophilic addition, along with the rules for drawing curly arrows.

Your ultimate guide to a successful Parents' Evening
Parents' evening provides a valuable opportunity to engage with your child’s teachers, gain insights into their progress, and address any concerns you or your child may have. Find out how you can make the most of these brief appointments and best support your child using this ultimate guide to a successful parents' evening.

Cold calling in English: Sparking literature discussions in class
Struggling to get your English class talking? Discover why traditional cold calling doesn’t always work in English classrooms and learn simple strategies to encourage meaningful engagement and discussion. Bring your lessons to life with methods that work for the unique dynamics of English classrooms.
Search by Topic
- Behaviour (1)
- Diversity (1)
- Finances (4)
- Inspection and Observation (2)
- Leadership (1)
- Pedagogy (16)
- Planning and Organisation (3)
- Post-16 Options (7)
- Revision and Exams (13)
- Science Teaching (4)
- SEND Teaching (3)
- Study Skills (12)
- Tuition (12)
- University (13)
- Wellbeing (13)
Related Posts

Applying to Oxbridge: Is it worth it?
Considering applying to Oxbridge but unsure if it's worth it? This article debunks common myths about Oxbridge admissions, from state school representation and financial costs to academic requirements and the infamous interview process. Get valuable insights and practical advice from an Oxbridge graduate!

Essential maths skills for A Level Biology
Strong maths skills are essential for success in A Level Biology. In this article, expert examiner Teresa outlines which math skills you need to know and how you can practice them effectively. With practical tips and clear guidance, you'll gain the confidence to tackle maths questions with ease.
Join Our Community
Sign up to our monthly newsletter to be kept in the loop about new resources, blogs and more.
Our ambition is to guide students from secondary school into their adult life.
- Uni Admissions
- Bursary Scheme
- For Schools
- Revision Resources
- Computer Science
- Find a Tutor
- How it Works
- Teacher Resources
- Information
- Privacy Policy
- Terms and Conditions
- Safeguarding Policies

IMAGES
VIDEO
COMMENTS
We provide the tools for most types of data presentation techniques used to visualise raw geographical data. These are quick and easy to use, free with no account or log-in required.
Graphical Data Presentation Methods. Bar Charts. Bar charts are useful when tracking a change (normally over time), or when comparing factors. fferent groups. The horizontal axis (x) usually contains the independent variable, which could be time, or the groups that w.
Justifying your choice of data presentation Your findings can be presented with a range of graphical and mapping techniques. Each form of data presentation needs to be justified.
Remember that the techniques you use should provide you with a range of quantitative and qualitativedata that is suitable to analyse in your investigation. Try to only choose techniques that will provide you with relevant data for your investigation. General Data Collection Methods
presentation of relevant data. Presenting data involves the use of a variety of different graphical techniques to visually show the reader the relationship between different data sets, to emphasise the nature of a particular aspect of the data or to geographically ‘place.
Your NEA should be one of the best bits of your Geography A Level! It's your chance to pick a topic that really interests you, apply your understanding of Geography to a real place that is familiar to you and collect and analyse your own data. Let's get started!
Geographical investigations. The independent investigation is worth 20% of the overall marks in A level Geography. This guide will help you through the processes of planning, collecting and presenting data, analysis and evaluation. Independent investigations. Introduction and planning.
A-level Geography teaching guide: fieldwork – September 2017 the suitability of sampling sites whether data collecting techniques should be modified. For example, if conducting a questionnaire, get students to try out the questions on a small trial group to see if this produces the data they need. Questions can then be
To achieve the top marks in your Geography NEA, you need to use a wide variety of data presentation methods. I recommend looking at PMT’s guide to data presentation before you begin: AQA data presentation guide; OCR data presentation guide; Edexcel data presentation guide; WJEC data presentation guide; This is another opportunity for you to ...
3.3.4.3: (Area 3) Methods of Critical Analysis. Essential Notes. Introduction . is collated and presented through a range of presentational techniques. The graphs, charts, maps and other sources you create are then analysed with regards to your hypotheses/ sub-questions, which should eventually . llow for your main hypothesis/