- 0 Shopping Cart

Lombok Indonesia Earthquake 2018 Case Study
The causes, effects, and responses to the Lombok earthquake
Lombok is one of the 17508 islands that make up Indonesia. The island is approximately 4,500 sq km (1,700 sq miles) and is located to the east of Bali and west of Sumbawa part of the Lesser Sunda Island chain. It’s known for beaches and surfing spots, particularly at Kuta and Banko Banko (in south Lombok).
In the first in the series, on 29 July, a 6.4 magnitude quake triggered landslides in the mountain region of the island and killed at least 16 people. Following this a shallow, magnitude 6.9 earthquake struck Lombok and Bali on August 5th, 2018, killing over 555 people, injuring 1300 and leaving at least 353000 homeless. The most severe damage was in North Lombok close to the epicentre.

Location of the August 5th 2018 Lombok earthquake
The main quake struck at 19:46 local time (11:46 GMT) on Sunday, August 5th at a fairly shallow depth of 31km (19 miles).
Earthquakes are common in Indonesia because it lies on the Ring of Fire – the line of frequent quakes and volcanic eruptions that circles virtually the entire Pacific Rim.
More than half of the world’s active volcanoes above sea level are part of the ring.
The recent earthquakes have occurred along a specific zone where the Australian tectonic plate meets the Indonesian island plate, Sunda.
Tectonic plates are slabs of the Earth’s crust that move very slowly over our planet’s surface. Indonesia sits along the “Pacific Ring of Fire” where several tectonic plates collide and many volcanic eruptions and earthquakes occur.

The Earth’s tectonic plates
Some of these earthquakes are very large, such as the magnitude 9.1 earthquake off the west coast of Sumatra that generated the 2004 Indian Ocean tsunami . This earthquake occurred along the Java-Sumatra subduction zone , where the Australian tectonic plate moves underneath Indonesia’s Sunda plate.
Both earthquakes occurred along faults in an area where tectonic plates are colliding, with one diving beneath the other.

The Sunda Plate
In this area, there’s subduction, so the Australian plate is moving under the Sunda plate, and the Australian plate is moving to the north underneath the Sunda plate.
The earthquake destroyed tens of thousands of homes, mosques and businesses across Lombok on August 5 2018. More than 1,300 people were injured and nearly 353,000 have been internally displaced.
It is estimated that 80% of the region had been damaged by the earthquake. Lombok suffered more than 5 trillion rupiah ($342 million; £268 million) in damage following the 5 August earthquake, authorities said.
Hundreds of tourists were stranded on the island and hotels were filled to capacity. No tourists were reported killed, but the earthquake was felt as far away as the neighbouring island of Bali, where two people died. The quake was followed by more than a dozen aftershocks, with one registering magnitude 5.4 on the Richter Scale.
According to scientists from NASA and the California Institute of Technology’s rapid-imaging project, the earthquake lifted the island as much as 25 centimetres in some areas. In other places, the ground dropped five-15cm.
Emergency teams in East and North Lombok reported that in some villages 75% of homes were damaged.
More than 500 hikers, most of whom were foreigners, were stranded on Indonesia’s Mt Rinjani when a deadly quake triggered landslides. The earthquake triggered landslides around Mount Rinjani, cutting off escape routes. The volcano , which rises 3,726m (12,224ft) above sea level and is the second-highest one in Indonesia, is a favourite among sightseers.
The region was hit by more than 350 aftershocks. Some measured up to 6.2 on the Richter Scale and brought down some buildings.
The area around Mount Rinjani increasingly relies on tourism , the earthquake and aftershocks led to the closure of mountain to hikers leading to many hotel cancellations by international tourists.
Hundreds of British citizens and European citizens were stuck in Lombok airport before flights could resume.
Aftershocks killed at least a further 13 people as the region recovered from the main event.
The Indonesia Government declared a three-week long state of emergency. “The most important thing is the emergency response, after that rehabilitation and reconstruction,” said Indonesia’s second-in-command, Vice President Jusuf Kalla. The government mobilised the National Disaster Mitigation Agency (BNPB) and the national military, directly deploying personnel in response to the earthquake.
Two helicopters were deployed to assist in emergency operations and the military sent troops and medical personnel, as well as medical supplies and communications equipment. Five planes carrying food, medicine, blankets, field tents and water tankers left the capital, Jakarta, for the island early on Wednesday 8th August.
Supplies for those made homeless were distributed with about 30,000 tents and 100 wheelchairs sent to affected areas.
As hospitals and clinics were affected by the earthquake many of the injured were treated in the open air or in makeshift clinics.
Rescue efforts were hampered by power outages, a lack of phone reception in some areas and limited evacuation options. A lack of heavy lifting equipment also affected the relief effort, with some rescuers forced to dig by hand. Other obstacles in the mountainous north and east of Lombok included collapsed bridges and electricity and communication blackouts. Debris blocked damaged roads.
In Sembalun the community pulled together to repair damaged buildings, including the town’s only health clinic. Electricity and clean water had to be being restored to villages in Sambalia that were cut off.
Emergency workers gradually reached more remote areas of Lombok having focussed their initial efforts in urban areas.
More than 500 hikers who were stranded on a mountain on the Indonesian island of Lombok after the earthquake were safely evacuated. Most of the hikers and guides were able to walk down after a safe route was found for them but some were flown out by helicopter.
The UK Foreign Office worked with the Indonesian authorities to provide assistance to British people caught up in the earthquake. Extra flights were added to help people who want to leave Lombok. Airport authorities requested that additional flights be added on Monday 6th August 2018 , to accommodate the influx of tourists trying to leave the island.
Charity, Plan International, provided counselling for children and supported those who were unable to go to school, by distributing emergency school kits and helping teachers continue educating while schools remain closed. The charity also provided humanitarian assistance to 2,500 families in six villages in Lombok. The organisation dispatched 500 emergency shelter kits, containing 1,000 tarpaulins, 1,000 sleeping mats and 2,000 blankets.
The Salvation Army in Indonesia also provided medical and other assistance to people who were affected by the earthquake on Lombok. The team immediately distributed a small supply of rice, noodles, sugar and bottled water to the affected population.
The Indonesian Red Cross (Palang Merah Indonesia) disaster responders provided first aid and assessed immediate needs in remote villages, arranging for bottled water and rice to be delivered by motorbike.
British-based charity Oxfam said it was providing clean drinking water and tarpaulin shelter sheets to 5,000 people and planned to intensify aid delivery.
A French military transport plane delivered 25 tonnes of humanitarian aid to the earthquake-hit island of Lombok on behalf of the Indonesian government.
On the 14th August 2018, The EU announced a further €500 000 to step up its emergency response to meet the most pressing needs of those affected by the devastating earthquakes that struck the Indonesian island of Lombok in late July and early August. The allocation came in addition to the initial €150 000 delivered earlier in August, thus bringing the EU’s contribution to €650 000. The EU humanitarian funding complemented the Indonesian government response and focussed on the most vulnerable groups and communities in the affected area. The EU aid supported the International Federation of Red Cross and Red Crescent Societies (IFRC) in providing relief assistance and protection to the most vulnerable among the affected population. It is estimated that the aid directly benefited 80 000 vulnerable people in some of the worst hit localities in the northeast and west Lombok districts. The aid was also used to assist the IFRC in reuniting families that were separated by the earthquakes. Aid was also offered by other countries including Australia.
Allegedly, authorities on Lombok were demanding money from tourists before they would let them onto rescue boats. However, around 5000 tourists who wanted to be evacuated from three outlying holiday islands had left by boat.

Premium Resources
Please support internet geography.
If you've found the resources on this page useful please consider making a secure donation via PayPal to support the development of the site. The site is self-funded and your support is really appreciated.
Related Topics
Use the images below to explore related GeoTopics.
Amatrice Earthquake Case Study
Topic home, 2018 sulawesi indonesia earthquake and tsunami case study, share this:.
- Click to share on Twitter (Opens in new window)
- Click to share on Facebook (Opens in new window)
- Click to share on Pinterest (Opens in new window)
- Click to email a link to a friend (Opens in new window)
- Click to share on WhatsApp (Opens in new window)
- Click to print (Opens in new window)
If you've found the resources on this site useful please consider making a secure donation via PayPal to support the development of the site. The site is self-funded and your support is really appreciated.
Search Internet Geography
Top posts & pages.
Latest Blog Entries
Pin It on Pinterest
- Click to share
- Print Friendly
- Skip to main content
- Keyboard shortcuts for audio player

Environment Story Of The Day NPR hide caption
Environment
- LISTEN & FOLLOW
Your support helps make our show possible and unlocks access to our sponsor-free feed.
Why Earthquakes In Haiti Are So Catastrophic

Jaclyn Diaz

Locals recover their belongings Sunday from their homes destroyed in the earthquake in Camp-Perrin in Les Cayes, Haiti. Joseph Odelyn/AP hide caption
Locals recover their belongings Sunday from their homes destroyed in the earthquake in Camp-Perrin in Les Cayes, Haiti.
It happened again.
Over the weekend, Haiti was hit by a magnitude 7.2 earthquake that crumbled homes and buildings and killed more than 1,200 people.
Rescuers are still working to find survivors amid the rubble. The death count is expected to rise.
More than a decade ago, a similar quake left an estimated 220,000 dead, more than 1 million people displaced and roughly 300,000 injured.
These two events are part of Haiti's history of major destructive earthquakes, records of which go back centuries.
Researchers say the country's unique geology make it seismically active — and prone to devastating earthquakes. A combination of factors, however, leaves the country especially susceptible to damage from these events.
Why is Haiti so susceptible to earthquakes?
Haiti sits on a fault line between huge tectonic plates, big pieces of the Earth's crust that slide past each other over time. These two plates are the North American plate and the Caribbean plate.
There are two major faults along Hispaniola, the island shared by Haiti and the Dominican Republic.
A map of the 2010 earthquake in Haiti shows dotted orange lines indicating fault lines. The nation sits on a fault line between huge tectonic plates of the Earth's crust — the North American plate and the Caribbean plate. Alyson Hurt/NPR hide caption
The southern one is known as the Enriquillo-Plantain Garden fault system.
It's this fault that the U.S. Geological Survey says caused Saturday's quake and the same one that caused the January 2010 earthquake.
The USGS believes the Enriquillo-Plantain Garden fault zone can be blamed on other major earthquakes from 1751 to 1860. The agency said none of these quakes has been officially confirmed in the field as associated with this fault, however.

Haiti Quake: Ruin And Recovery
The anatomy of a caribbean earthquake, a history of catastrophic earthquakes in haiti.
One of the earliest major recorded earthquakes in Haiti occurred in the 1700s, according to the USGS. Others followed, with researchers cataloging events that left hundreds dead and destroyed homes and businesses.
- Nov. 21, 1751: A major earthquake destroys Port-au-Prince and causes major destruction in nearby towns. Witness accounts of the event from the National Centers for Environmental Information recount the devastation . "Houses and factories were thrown down at St.-Marc, Lkogbne, and Plaine du Cul-de-sac. Crevices formed and abundant springs of nauseous water broke forth," researchers who witnessed the event described it. "Great landslips occurred and the beds of the rivers changed direction."
- June 3, 1770: An earthquake hits Port-au-Prince again. Researchers described the event as "one of the strongest shocks recorded on the Island of Haiti." An estimated 200 people in the nation's capital died as a result of the earthquake.
- April 8, 1860: This earthquake occurred farther west of the 2010 earthquake, near Anse-à-Veau, and was accompanied by a tsunami. "At Anse-a-Veau, crevasses sliced across the streets and 124 houses were demolished; at Miragoane, the bridge sank; at Petit Goave, all the houses were abandoned ... ," researchers said of the event. "Ships in the harbor of Les Cayes felt the shock, as did ships at sea."
Before the 2010 earthquake, there hadn't been another major quake along the Enriquillo-Plantain Garden fault zone for about 200 years.

In January 2010, people work to free trapped victims from the rubble of a collapsed building after an earthquake in Haiti's capital of Port-au-Prince. Gerald Herbert/AP hide caption
In January 2010, people work to free trapped victims from the rubble of a collapsed building after an earthquake in Haiti's capital of Port-au-Prince.
Building to withstand hurricanes, not earthquakes
The USGS says it recorded 22 magnitude 7 or larger earthquakes in 2010, the same year as the devastating earthquake in Haiti. However, despite an active year, almost all the fatalities were produced by the major temblor that hit on Jan. 12 of that year, the USGS said.
It struck around the densely populated capital of Port-au-Prince, contributing to the high death toll.
But the way structures are built in Haiti is also believed to have contributed to the loss of life and property.
Due to the 1751 and 1770 earthquakes and minor quakes that occurred between them, local authorities started requiring building with wood and forbade building with masonry, according to the USGS.
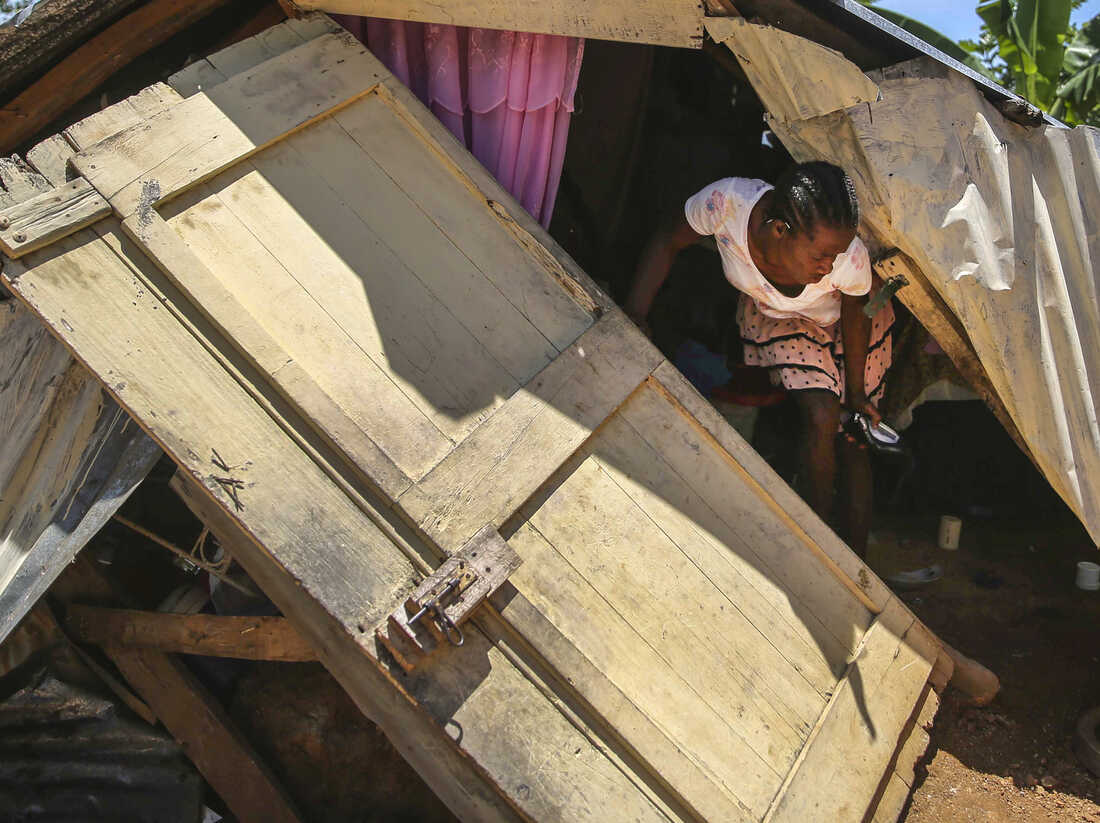
A woman tries to recover her belongings Sunday amid the rubble of her home destroyed by the quake in Camp-Perrin in Les Cayes. Joseph Odelyn/AP hide caption
A woman tries to recover her belongings Sunday amid the rubble of her home destroyed by the quake in Camp-Perrin in Les Cayes.
In the years since, Haitians have focused on building their homes to withstand the bigger threat in the neighborhood — hurricanes.
Structures made of concrete and cinder block hold up well during storms but are more vulnerable during earthquakes, according to The Associated Press .
More earthquakes may be ahead
In 2012, researchers wrote that the 2010 earthquake "may mark the beginning of a new cycle of large earthquakes on the Enriquillo fault system after 240 years of seismic quiescence."
"The entire Enriquillo fault system appears to be seismically active; Haiti and the Dominican Republic should prepare for future devastating earthquakes," researchers said.
It's still too early to determine the long-term impact of Saturday's earthquake. What is certain is the unique pressures facing Haitians in the days ahead.
The country still has not fully recovered from the 2010 earthquake and Hurricane Matthew in 2016.

Latin America
Ariel henry will become haiti's prime minister, ending a power struggle.
Haiti was already suffering from political instability following last month's assassination of President Jovenel Moïse. Moïse's death has since left a power vacuum that's been filled by interim Prime Minister Ariel Henry, a 71-year-old neurosurgeon and public official.
The nation is also bracing for another threat as Tropical Depression Grace threatens to bring heavy rains on Monday.
- earthquakes
Nepal Earthquake Case Studies

About the Project
On April 25, 2015, Nepal and its people experienced a 7.8 magnitude earthquake. On May 12, another major earthquake of 7.2 magnitude hit the country. In practice, his means that millions of Nepalis have lived and died under the weight of falling buildings, landslides, floods, hunger, and homelessness brought about by massive seismic shifts across the Himalayan belt. Most will refer to this as an earthquake, singular. But this is no singular disaster. The country has experienced more than 300 seismic events since April 25, 2015, and nearly 9000 people died as a direct result of the two most major earthquakes.
For most of Nepal’s approximately 30 million people, living uncertainty is old hat. Consider the legacies of civil war (1996-2006) followed by a decade of political instability and current struggles to write a viable constitution. But the spring of 2015 has cracked open new forms of vulnerability for most Nepalis. These quakes have caused enormous destruction to the nation’s rich cultural heritage, in the Kathmandu Valley and beyond. The countryside has experienced vast devastation. More than half a million homes have been destroyed or are precariously habitable. This equates to about 2.5 million internally displaced. More than 3,500 schools have been destroyed and nearly as many health posts. There has been widespread damage to highways and road networks; glacial lakes are in danger of bursting; landslides are a constant threat, and have continued to wipe out settlements; many hydroelectric dams have been damaged; water borne illness and other public health challenges loom as monsoon has arrived. Even so, Nepalis are showing incredible resilience, creativity, and deep commitments to helping each other through this suffering.
This project – in the context of ANTH 55: Anthropology of Global Health – explores the human impacts of these disasters by asking students to engage in collective research and writing of case studies focused on specific areas of inquiry related to the earthquake.
The assumption of this project is not that students will become “experts” either on Nepal or on the health effects of earthquakes, but that they will amass sufficient knowledge about their area of inquiry so that they can contribute to an effort to expand knowledge and understanding of this event to others, and expand in the process their own conceptualization of what “global health” is, where and how it occurs, and how it links to many other aspects of human life.
Advertisement
Post-earthquake damage classification and assessment: case study of the residential buildings after the M w = 5 earthquake in Mila city, Northeast Algeria on August 7, 2020
- Original Article
- Published: 21 November 2022
- Volume 21 , pages 849–891, ( 2023 )
Cite this article

- Hamidatou Mouloud 1 ,
- Amar Chaker 2 ,
- Hallal Nassim 1 ,
- Saad Lebdioui 3 ,
- Hugo Rodrigues 4 &
- Matthew R. Agius 5
4599 Accesses
13 Citations
2 Altmetric
Explore all metrics
On August 7th, 2020, a magnitude Mw = 5.0 earthquake shook 5 km north of Mila city center, northeast of Algeria, causing substantial damage directly to structures, and indirectly from induced impacts of landslides and rock falls, ultimately disrupt to everyday civilian life. Given the recent significant seismic occurrences in the region, a detailed and comprehensive examination and assessment of post-earthquake damage is critical to Algeria. This is primarily because masonry, concrete, and colonial-era structures are sensitive to horizontal motions caused by seismic waves, and because masonry and concrete structures constitute a substantial portion of today’s Algeria's build environment. We present a post-earthquake investigation of the Mila earthquake, starting from the earthquake source, and a catalogue of buildings type, damage categorization, and failure patterns of residential structures in Mila's historic old town, where colonial-era brick buildings prevail. We find that structures that represent notable architectural achievements were severely damaged as a result of the earthquake. Data acquired during the immediate post-earthquake analysis was also evaluated and discussed. The graphical representations of the damages are detailed and complemented by photos. This seismic event has shown the fragility of Algeria's building stock, which must be addressed properly in future years. This study reports on an overall estimate of residential buildings in Mila's lower city, as well as an evaluation of the seismic vulnerability of three neighborhood towns (El-Kherba, Grareme-Gouga, and Azzeba). A generic database for graphical surveys and geometric research was developed and implemented making it possible to evaluate the shear strength on-site. The broad observations, collated data, and consequences were then loaded into the 3Muri structural verification program. Nonlinear static analysis was conducted to analyze probable failure paths and compare the real damage to the software results.
Geological Structural Analysis Applied to Archaeoseismology
Seismic response of rc buildings during the mw 6.0 august 24, 2016 central italy earthquake: the amatrice case study, damage classification and derivation of damage probability matrices from l’aquila (2009) post-earthquake survey data.
Avoid common mistakes on your manuscript.
1 Introduction
A seismic event is a rare natural occurrence that may induce enormous costs and consequences for structures, the environment, human life, and society. On August 7, 2020, at 06:15:37 UTC, an earthquake of a moderate magnitude Mw = 5.0 (Boulahia, 2022 ) and intensity VI on the European Macroseismic scale EMS-98 struck the Mila metropolitan region (Eurocode 8 2004a , b ). It was followed at 08:12:43 UTC by the strongest aftershock earthquake, with a magnitude Mw = 4.8 (Boulahia, 2022 ), and intensity of V. The primary earthquake destroyed a substantial number of structures in three areas (El-Kherba, Grareme-Gouga, and Azzeba), including both residential and public buildings. The vast majority of structures built following Algeria's earthquake code (RPA, Règulement Para-sismique Algerien 2003 ) were either undamaged or only minimally impacted by other correlated hazards, like landslides. However, most of the city (upper and lower areas) was severely affected since structures were constructed without earthquake design concerns and on unstable soils, besides, an important part of the construction was built without official approval. The destruction of buildings is considerable; over 1040 structures were affected, many of which were seriously destroyed (Fig. 1 ). At the end of the year, another moderate earthquake ( Mw = 5.2) struck Northeast Algeria, with Skikda as the epicenter, about 60 km from Mila. The seismic event triggered minor secondary impacts to already damaged constructions.

Illustration of typical structure damage following the Mila earthquake
Seismic vulnerability assessment for past earthquake in Northeast Algeria has been relatively newly initiated, starting on 1992 by Farsi and Belazougui ( 1992 ). The current work consists of regional and local studies, mainly based on seismic vulnerability assessments by (Bechtoula and Ousalem 2005 ; Laouami et al. 2006 ; Harbi et al. 2007a , 2007b ; Belazougui 2008 ; Hellel et al. 2010 ; Meslem et al. 2012 ; Mehani et al. 2013 ; Boukri et al. 2013 ; Remki and Benouar 2014 ; Hamidatou et al. 2017 ; Chimouni et al. 2018 ; Allali et al. 2018 ; Hichem et al. 2019 ; Akkouche 2019 ; Amari et al. 2020 ). We know that the first major hazard that threatens the Mila region is landslide, in this case several studies have assessed landslides’ risk as well as earthquake-triggered landslides’ risk in the region (Marmi et al. 2008 ; Atmania et al. 2010 ; Guemache et al. 2010 ; Semmane et al. 2012 ; Merghadi et al. 2018 ; Benfedda et al. 2021 ; Tebbouche et al. 2022 ; Smail et al. 2022 ; Bounemeur et al. 2022 ; Medhat et al. 2022 ).
Algeria has a vast number of modern constructions made of reinforced concrete (RC), masonry, and colonial 19th and 20th-century style buildings. Assuming that most of the ostensibly "strategic" projects of cultural and historical value are constructed of masonry, this suggests that old masonry constructions must be evaluated and repaired according to the highest standards (Atalić et al. 2019 ; Ortega et al. 2019 ; Rodríguez et al. 2019 ; Stepinac et al. 2020 ; ARES 2021 ). Pushover analysis, also known as nonlinear static evaluation, is crucial and is suggested as a reference technique in Eurocode 8–3 for such cases. Even though the engineering community has made significant advances in comprehending seismic occurrences and their consequences, there are still many unknowns and uncertainties. Earthquake engineering requires a better description of seismic motions and new robust tools for analyzing buildings and assessing seismic hazards and risks. In the previous several decades, structural standards have been carefully researched, developed, and improved to the point that they now allow for designing new types of structures while preventing major damage to human life. It is also necessary to have the ability to evaluate the response of structures to earthquake ground shaking. The seismic risk of existing masonry constructions is difficult to assess and necessitates specialized technical knowledge (Lourenco and Karanikoloudis 2019 ). Post-earthquake condition evaluation may be described as the process of determining the safety and usability of a structure following a seismic event. Many factors influence structural seismic performance, including the number of floors, roof shape, age of construction, building materials, the geometry of the structure, stiffness, strength, ductility properties, soil conditions, and seismic event characteristics. Information from multiple disciplines, such as tectonics, geophysics, seismology, geology, and civil engineering including geotechnical and structural engineering, mathematics, or applied statistics, is required.
Afterward the earthquake, the first to respond to a catastrophe were civil engineers who led and coordinated the entire organization of building assessment and construction damage analysis. Several similar post-earthquake assessment procedures are used internationally (Yavari et al. 2010 ; Marshall et al. 2013 ; Didier et al. 2017 ). In the first week after Mila earthquake, a large number of constructions were examined, with a rapid post-earthquake assessment. The most endangered buildings in the city’s center were the ones under cultural heritage protection. The aim of a rapid assessment of structures is to determine the degree of damage to buildings concerning the protection of life and property, that is, to determine if the structures are usable, temporarily unusable or unusable. Emerging technological advances allow the usage of artificial intelligence in the post-earthquake assessment process in the form of machine learning methods for more efficient and precise results (Bialas et al. 2016 ; Zhang et al. 2018 ; Kim et al. 2020 ; Natio et al. 2020 ; Stepinac and Gasparuvic 2020 ).
Mila is a rural area separated into three zones: Zone A, Zone B, and Zone C (Fig. 2 ). Mila's most ancient architectural districts are found in Zone A, which is defined by packed blocks of structure masonry, brick, or a mix of materials. The majority of structures are made out of solid longitudinal and transverse walls, brick ceiling vaults, or timber ceiling beams with reinforced concrete roofs. Some schools, commercial structures, residential and government structures, cultural institutions, and monuments are located in Zone A, and are either components of a historical city structure or stand as lone landmark buildings. The earthquake-caused landslides severely damaged 10% of the structures in Zone A. Zone B is made up of a wide range of urban designs and includes a high number of structures. The landslide zone triggered by the seismic event is Zone C, and some buildings in this area have been significantly damaged. The seismic event occurred throughout the COVID-19 pandemic lockdown and caused a critical interruption to the social restrictions adapted at that time. The research focuses on the post-earthquake investigation, damage categorization, and failure patterns of masonry residential projects in the Mila region. We present primary data acquired by onsite inspections and provide an updated and broader insight to the seismic hazard of the Mila region. We also run 3D modelling to better understand the response of building in similar conditions.

Protected areas A, B, and C, as well as the region of the analysis within the Mila (yellow dashed line)
In fact, the main shock triggered many large landslides, of which, the traces are traceable and the impact on individual houses is significant. The most important one was observed in the El Kherba region (Zone C in Fig. 2 ), a catastrophic one which caused damage to residential structures. A substantial number of structures and infrastructures in the landslide's neighbourhood has been severely damaged. According to this study in post-earthquake categorization, about 10% of structures were damaged in zone A, 15% in zone B, and 61% in zone C. Exhibiting the important effect of the major earthquake-triggered landslide in zone C.
According to Benfedda et al. ( 2021 ), six landslide zones have been identified using InSAR analysis of two Sentinel-1A images, taken before and after the August 7 event main shock. The landslides were located along a 22 km long and 6.5 km wide corridor oriented NE-SW. Furthermore, Medhat et al. ( 2022 ) detected tow landslide zone in far-separated regions, Kherba city and Grarem Gouga city using the 2D decomposition MT-InSAR approach to detect the deformation velocity before the landslide activity, retrieving displacement velocity rates up to ~ 50 mm/year. Two regions were located at 12 km apart, indicating slow motion rather than fast movement along the damaged area. In addition, Halla et al. ( 2022 under publication) three large landslides have been observed within 13 km radius. The three landslides are located South, Southwest and Southeast. The most important one is that of the El-Kherba district: the Western extension of Mila city. The second landslide is located just near the epicenter within a radius of 5 km, East of Grrarem-Gouga village. The last landslide is the least important. It is located in the Azzeba village, situated Southeast of Mila city.
A thorough and more thorough post-earthquake damage assessment is required in light of the recent devastating earthquakes in Algeria. This is particularly crucial for Algeria since the bulk of the country's buildings are made of masonry, which makes them extremely sensitive to earthquake-induced horizontal movements. An exhaustive assessment of a residential structure in Mila's lower town is given in this paper. Geometric surveys and visual inspections were both part of a comprehensive program that was developed and executed. This earthquake brought to light Mila's vulnerable building stock, which has to be mitigated as effectively as possible going forward. To minimize earthquake losses, determining the characteristics of susceptibility and evaluating the seismic performance of existing structures are crucial (Endo et al. 2017 ; Casapulla et al. 2018 ; Ortega et al. 2018 ; Valente and Milani 2019 ; Hichem et al. 2019 ; Grillanda et al. 2020 ).
2 Historical seismicity and the seismic sequence in Mila
2.1 seismicity in algeria's northeast.
Many seismic events have shaken Algeria's Northeast in the past. The strongest earthquakes were the tsunamigenic earthquakes that struck the city of Jijel (previously Djidjelli) on 21 and 22 August 1856, with an intensity of X on the EMS scale, and affected Djidjelli and the nearby region (Harbi et al. 2011 ). According to ancient sources, the earthquake generated a tsunami and caused extensive damage in the city, with more than 30 people killed and many collapsed structures. Figure 3 is a map of major earthquakes in northern Algeria with their surface magnitudes Ms . Only a few significant earthquakes have happened in Algeria's northeastern region in more than a century. As a result, public awareness and readiness were at an all-time low. Though authorities and scientists have warned for years about the repercussions of a catastrophic earthquake and about the importance of planning for a swift response after an earthquake (vulnerability assessment, rescue and care of people, damage assessments, etc.…), preparedness actions have been limited (Atalić et al. 2019 ; Stepinac et al. 2020 ).

Strong earthquakes in Algeria's Northeast and surrounding regions in the previous century from 1900 to 2021, the red square indicates the Mila region (Hamidatou et al. 2017 , 2019 , 2021 )
Mila is located in the NW of the Constantine basin, which, with its tectonic configuration, is the key cause of earthquakes in the zone (Durand 1969 ; Raoult 1974 ; Vila 1980 ; Coiffait 1992 ). The 1985 Constantine earthquake (Ms = 6.0, Ousadou et al. 2012 ), the worst seismic event registered in the area, triggered substantial damage in the city and was felt in the Mila area. According to historical records, the earthquake produced extensive damage to constructions (108 structures were damaged) and caused two fatalities and injured 10 inhabitants (Bounif et al. 1987 ). The 1985 earthquake was a watershed moment in Northeast Algeria’s development and city planning. However, since strong seismic events occur across relatively extended time periods, the lessons of the past are easily forgotten. Even though 50 percent of the North Algerian region is vulnerable to severe seismic shaking, and 70% of the population lives in this region, the public’s risk awareness is low.
2.2 The seismic sequence in Mila on July–August 2020
In the period including July and August 2020, the Mila region witnessed a seismic sequence that was marked mainly by the appearance of three important shocks. Recently, Benfedda et al. ( 2021 ) studied the main events of the July–August 2020 Mila seismic sequence, including, respectively, the events on July 17 at 08:12 UTC (Mw 4.6), August 7 at 06:15 UTC (Mw 4.8) and at 11:13 UTC (Mw 4.4). More recently, Boulahia ( 2022 ) examined the first shock of July 17, 2020 at 08:12 UTC of Mw 4.8, located 1 km North of Sidi Merouane (near Grarem-Gouga area), a second shock on the August 7, 2020, at 06:15:37 UTC, where he stated a Mw magnitude of 5.0, and a third shock at 11:13:27 UTC of a Mw 4.5 (Boulahia 2022 ). The main shock (the second one) had an intensity of VI according to the EMS-98 scale, it also triggered a spectacular landslide in the El Kherba region. This landslide caused significant damage to individual buildings (Fig. 4 ).

Preliminary Earthquake Intensity Map (left) from the earthquake of August 7, 2020, at 6:15:37 (UTC) compared with predicted peak ground accelerations (right) for a return period of 475 years (Hamidatou et al. 2021 ), the red square indicates the Mila region
Benfedda et al. ( 2021 ) performed a waveform inversion of the accelerograms to calculate the seismic moment, moment magnitude, and focal mechanisms of the three main seismic events:
The July 17th, 2020, Mo = 1.019E + 16 Nm, Mw = 4.6, h = 5 km.
The August 7th main shock, Mo = 1.794E + 16 Nm, Mw = 4.8, h = 8 km.
The August 7th aftershock, Mo = 4.653E + 15 Nm, Mw = 4.4, h = 12 km.
They determined focal mechanisms generated a pure strike-slip solution for the three events with nodal plans oriented NE-SW and NE-SW and a pressure axis oriented N-S.
In addition Boulahia ( 2022 ) used an Empirical Green’s Function (EGF) method to derive the Relative Source Time Functions (RSTF’s) and high-resolution relocation to active structures and analyzed the spatiotemporal behavior and mechanics of the sequence. They managed to separate the initial seismic cloud into two densely concentrated spatial clusters of strongly correlated events, and were able to detect components of directivity toward the southeast for the shock (Mw 4.8) and directivity toward the northeast for the mainshock (Mw 5.0).
The July 17th, 2020, Mo = 2.14 × 10¹⁶ N.m, Mw = 4.8.
The August 7th main shock, Mo = 3.14 × 10¹⁶ N.m, Mw = 5.0.
The August 7th aftershock, Mo = 0.67 × 10¹⁶ Nm, Mw = 4.5.
They relocate over 981 events from the sequence, with structures matching moment tensor solutions and focal mechanisms indicating predominantly right- and left-lateral strike-slip ruptures. The results reveal orthogonal conjugate structures—one trending ~ N65W and dipping 80°SW, and one trending ~ N28E, 70°NW-dipping fault plane. The earthquakes evolved in two phases, with a spatiotemporal migration of epicenters from the NW–SE fault plane to the NE-SW fault at a rate consistent with pore fluid diffusion (Boulahia 2022 ).
Furthermore, Benfedda et al. ( 2021 ) recorded the peak ground accelerations (PGAs) of the three major events in Mila by the local network. The Beni-Haroun station recorded the maximum accelerations for all events. The Beni-Haroun huge dam reservoir is just a few meters away from the BHAR station, which is situated in a free field and on hard rock on the NW side. The high values of ground motion of these relatively small earthquakes are explained by the near field and shallow depth of the seismic events. Hard rock often records such high acceleration values quite near to the hypocenters (Laouami and Slimani 2018 ).
The earthquake's epicenter was located at latitude 6.28 N and longitude 36.54E. The epicenter was located around 13 km Southwest of Mila center, in the Hamala area, at a depth of 7 km. The strongest aftershock occurred at 8:12:43 UTC, with an Mw magnitude of 4.8 (Boulahia 2022 ) and EMS-98 intensity V. The epicenter of this aftershock was about 10 km Southwest of Mila's center, at a depth of 10 km. On the same day, five aftershocks with Mw magnitudes larger than 3.0 and EMS-98 intensity V were observed. Following that, the city of Mila and its surroundings have been hit by a series of mild and medium aftershock earthquakes (Fig. 5 ).

Earthquakes with a magnitude more than 2.0 ( Mw ) occurred in Mila between August 7 and October 30, 2020
Even though the seismic event was of moderate magnitude, it caused a large amount of measurable damage. Seismic risk assessment in urban areas and building vulnerability are usually misread, therefore the majority of community media (and a section of the technical community) have consistently reported on the disparity between the magnitude of the earthquake and the degree of damage. Assuming that a thorough and complete seismic risk assessment for the city of Mila has not been conducted, such reporting is not unusual. Given that the PGA for the historic core of Mila, which was the subject of prior studies, was about 0.19 g, and that most of the structures are quite vulnerable, widespread damage should have been predicted (Hamidatou and Sbrtai 2016 , 2017 ; Hamidatou et al. 2019 ; 2021 ). The primary earthquake destroyed a substantial number of old urban structures, including residential buildings, administrative offices, colleges, and public institutions.
3 Procedure for immediate response and post-earthquake evaluation
The seismic event in Mila occurred during the strong restrictions imposed following the first wave of the COVID-19 pandemic, which imposed extra constraints on rescuer and researcher operations. Immediately following the earthquake, a multidisciplinary post-seismic disaster management team visited the Mila City Crisis Management Agency to examine the damaged state of the constructions and the possibility of their continued use in a timely manner. The Civil Protection Center was activated, and researchers, specialists, and experts from research centers and universities, as well as the CRAAG, were hired to organize work related to field condition assessment, installation of the seismic network and Global Positioning Systems (GPS), geological and geophysical field missions, rapid engineering assessment training, and the organization and development of an information system for dealing with disasters. All activities were conducted in partnership with the Ministry of the Interior's Civil Protection Directorate and the City of Mila's Civil Protection Authority.
Based on Italian results, a prototype technique for post-earthquake damage and useability study was proposed (Baggio et al. 2007 ) and EMS-98 (EMS 1998 ), because knowledge of seismic occurrences in northern Algeria is low, vigilance for such events and immediate actions was also poor. Until now, data on the number of structures, floor layouts, cross-sections, building materials, or function at the time of the earthquake were not available. The post-earthquake damage analysis includes a quick visual evaluation of each structural system, an indication of the degree of damage, and the categorization of the structure into each of six sections:
CN1 (dark red color): Not feasible due to external hazards—The construction is dangerous due to the likelihood of major portions of a nearby structure collapsing. It is advised not to remain in such facilities given the considerable number of aftershocks.
CN2 (red color): Unusable owing to damage—The structure is dangerous due to substantial structural damage, collapse, and failure. The structure has reached the limit of its loadbearing capability and ductility and cannot be utilized in any way. That does not always mean that the building must be destroyed.
PCN1 (dark yellow color): Possibly unusable—Full assessment required—The structure has a fair extent of the damage but no risk of collapse. The loadbearing capacity has been partly reduced. A shorter visit to the structure is conceivable, and a structural engineer should provide suggestions for future repair work.
PCN2 (yellow color): Temporarily unusable- Emergency rehabilitation measures required—The structure has some damage with no probability of collapse, but cannot be utilized owing to the possibility of failure of some structural components. The structural engineer is aware of emergency response methods and must give instructions to users. The structure, or a portion of it, is inoperable until the safeguards are put in place. Provisional usability may apply to elements of the structure (components) only.
CU1 (dark green color): Usable without limitations—There is no damage or only minor damage that does not jeopardize the structure's load-bearing ability and usage.
CU2 (green color): Consider Protective Measures.—Except for some elements where there is an immediate risk to a portion of the structure, the structure can be used. The building evaluator can grant authorization for sthe risk to be removed and advise the occupants to impose temporary residential limitations on specific portions of the structure. The structure can be used freely after the risk has been removed.
After Day 1, Class CU2 was used in the procedure because non-structural components of the structures were damaged and may endanger passers-by and members of the public. It was essential to eliminate these components as quickly and efficiently as possible. The structure was safe to use once the non-structural damaged components were removed.
The building typologies, structural damage, and failure patterns caused by the earthquake or landslide in the Mila city center area are depicted and discussed in the following sections. The brick structures that make up a considerable proportion of the city center and the surrounding area are given special attention. This study focuses on the typical damage and disaster to residential structures. Significant advancement has recently been achieved in understanding the seismic behavior of masonry buildings and analysis during seismic occurrences (Binda et al. 2000 ; Ortega et al. 2017 ; Vlachakis et al. 2020 ). It is hoped that the current data will positively contribute to further development in this field.
4 Typology of constructions in Mila
Mila's buildings typically consist of roughly 91,000 residential constructions and 5,000 non-residential constructions, according to the Algeria Population and Housing Census 2008, provided by the National Office of Statistics of Algeria. More than 20% of the construction stock is over 40 years old. The use of traditional materials and building techniques, like masonry and timber, is a defining feature of such older Mila structures. Most of the people in Mila province, particularly in the cities, work and reside in colonial constructions, especially in Mila's city core.
Throughout the city's and the surrounding areas’ history, numerous types of structures have been constructed depending on the advancement of construction technology, understanding of soil qualities, and urban planning, including urban protection measures and the demand for building areas. Knowing when a set of buildings were built provides a reasonable estimate of their seismic strength following the 1985 Constantine earthquake. Most of the structures in Mila's old city center are concrete and masonry constructions with timber floors and roofs. A single-story typical height varied from 2.5 to 3.7 m.
They followed RPA norms from 1996 to 2003, and after 2003, they followed RPA regulations (RPA 2003 ). As a result, many structures were built without any proper lateral force resisting system before any seismic regulations were implemented. In terms of floor systems, timber in older houses and reinforced concrete in later constructions are the most common options. Timber floors are more flexible than rigid concrete slabs. Because the connections between walls and floors are typically weak, this makes walls more susceptible to potential out-of-plane failure mechanisms.
New structures with four or more stories have been built in the city throughout the previous two decades. They were designed to withstand earthquakes. A mix of historic individual structures and new apartment towers distinguishes the urban area. Most single-family houses in Mila's immediate vicinity are one- or two-story brick structures. Contained masonry with reinforced concrete floor constructions is more recent than unreinforced stone masonry constructions with wood or reinforced concrete floors. About 17 percent of dwelling units in Mila were built before the first seismic code was enacted (1982), Fifteen percent of housing units were designed following the first seismic code (1962–1996), and 29% were built using the enhanced seismic code (Table 1 ). The RPA 2003 code was used to design housing units built after 2003.
Mila's historical city compound is a conservation area under the Act on Culture and Heritage Conservation and Maintenance. Zone A and Zone B are the two zones that make up the region (Fig. 6 ). The oldest and most architecturally key areas of Mila are in Zone A, which is the subject of this study. Both locations, however, have architectural and historic landmarks and are characterized by densely packed blocks of constructions using stone brick or a mix of materials. Many schools, businesses, residential and government structures, social organizations, and mosques are in Zone A and are conserved as part of a historical city structure or as separate historical sites, although they are not the subject of this research. Zone B contains the remaining parts of Mila's historic urban complex. It contains a wide range of urban forms as well as a considerable number of historically significant structures.

Heritage-protected zones in Mila (Zone A, Zone B, and Zone C). The yellow dashed line indicates the study's observation area
Once most of the buildings are constructed as part of bigger blocks, their sides are frequently the width of a leaf. The same building strategy was utilized even when the structures were built inside the blocks, i.e., as freestanding units, and these freestanding structures were severely damaged.
The inadequate connections between walls and floors are also observed, and since the floor structure is primarily wooden, the structures lack the so-called box-type behaviour. Timber flooring prevails despite the presence of multiple composite wooden concrete compound buildings. Because group of unreinforced masonry (URM) buildings are prone to damage from seismic excitations (Palazai et al. 2022 ), the damage was observed in a large number of structures following the Mila earthquake. The typical roof structure is a king or queen post truss; however, there are many distinct types of integrated timber roof constructions (Fig. 7 ). Due to rehabilitation work, a concrete slab beneath the roof systems can be found in a limited number of structures. Even though tie rods have been used for many years over the world, they were not widely used in Mila. Timber-reinforced masonry was used in very few examples in the ancient city core. After 1980, numerous new concrete constructions were put within the old downtown's existing building blocks, a trend that still exists today. These structures were either unaffected by the earthquake or suffered only minor non-structural damage. Newer buildings, on the other hand, tended to have more stories and less interstory height than older buildings, which clearly influenced the seismic response of neighboring structures (Fig. 8 ).

Typical residential structure (schematic representation)

Insertion of new concrete constructions "within" existing blocks during the building process and at the end
The lack of maintenance was identified as a key factor in the condition of structures following the earthquake. Because many structures were poorly or never maintained, the masonry strength deteriorated with time, the connection between the masonry and the walls was degraded, and the seismic performance of such buildings worsened. Water infiltration damaged the characteristics of both masonry and wood elements in numerous cases.
5 Case study: Sidi Ghanem Mosque
We studied the Sidi Ghanem Mosque, a building located in historical Mila city (Figs. 9 and 10 ). The Sidi Ghanem Mosque is the oldest mosque in Africa. Mila was once a Roman settlement. The Umayyad Arab forces arrived in 675 CE, about 59 AH. Under the direction of Abu al-Muhajir Dinar, they seized the city. That same year, it appears, the order was made to clear a site adjacent to a Christian Basilica and to build a mosque. The basilica had an abundance of building materials, stones, and columns that could be reused. The mosque, on the other hand, did not mirror the familiar Roman basilica or the Roman city street architecture, but it had an important meaning. Its 62 m-high minaret, for example, was constructed with 365 steps, representing the number of days in the year. The mosque of Abu al-Muhajir in Mila does not have a marked orientation. Here's a blueprint for the structure. It began as a mosque, but was later turned into a workshop and, finally, a hospital.

North façade view of the Sidi Ghanem Mosque

South façade view of the Sidi Ghanem Mosque
The Roman basilica was demolished to make way for the mosque to be rebuilt. The main construction is made of reclaimed materials from the old town. The reuse of Roman columns and marquees allowed the mosque to have more robust construction. The other materials used were full-size bricks made on-site. There are visible elements of a second-story building that the French-built to house the soldiers.
The state of disrepair of the Sidi Ghanem Mosque was worsened by the Mila earthquake. The study of the monument’s restoration, which began in 2019, focused in its first phase on "the state of the sites and emergency measures," in light of which emergency work was undertaken.
According to the Algerian seismic hazard map (Hamidatou and Sbartai 2017 ; Hamidatou et al. 2019 , 2021 ), for a return time of 475 years, the peak ground acceleration at the building site is 0.197 g. The building serves as an educational-cultural institution. Prior to the earthquake, the structure's state in terms of vertical loads was adequate and well maintained.
6 Residential building damage and common failure patterns
The earthquake severely damaged key architectural achievements and shattered Mila's historically identifiable city center. The vast majority of structures were constructed after the first mandated earthquake rules (i.e., during the 1980s) withstood the earthquake unscathed or with only minor damage. However, many structures in the historic district (Upper and Lower Town) were severely damaged. It is estimated that about 10% of the entire building stock was damaged in Zone A and more than 15% in Zone B—a total of 540 damaged buildings. However, in Zone C, 61% of the buildings were damaged, with a total of 743 building, i.e., more than the total of the damaged structures in Zones A and B gathered, exhibiting the substantial effect of the major earthquake-triggered landslide in zone C. (Table 2 ).
According to the previously mentioned post-earthquake categorization (red or N, yellow or PN, green or U), of 136 damaged structures in zone A, 97 were green-tagged, 35 were yellow-tagged, and 4 were red-tagged, whereas in zone B, of 404 damage structure, 342 were green-tagged, 55 were yellow-tagged, and 7 were red-tagged. However, in Zone C, among the 743 damaged buildings, 515 were green-tagged, 137 were yellow-tagged, and 91 were red-tagged. In Fig. 11 , the residential structures with usability tags are depicted on a map of the historical city center, whereas Fig. 12 depicts a typical building block. In this block, 17 buildings were green-tagged (13 percent of all damaged buildings), 20 (17 percent) were yellow-tagged, and 3 (4 percent) were red-tagged.

A detail of Mila city's building usability rating

Post-earthquake damage assessment for one typical block of buildings
The historic downtown is made up of blocks of aggregated buildings, a damage map for each one has been prepared (Fig. 13 ). The goal was to gather information on the risk of individual blocks as well as a prospective seismic vulnerability assessment for certain sections of Mila. Although it was assumed that blocks further away from the epicenter would be less damaged, the map in Fig. 13 reveals a significant spread and random outcomes.

Average damage index for each block of buildings
According to our post-earthquake assessment analysis, each individual building in the block was assigned a number on the map. CU1 buildings were assigned an index of 0.5, CU2 buildings were assigned an index of 1, PCN1 and PCN2 buildings were assigned an index of 3, and CN1 and CN2 buildings were assigned an index of 5.
Ni: Number of structures in each calculation mesh assigned to a damage category.
Based on the information received; these figures are enough for a basic indicator of damage or average index can be computed for the entire block. For the block depicted in Fig. 12 , the damage index is computed as a weighted average depending on the number of individual structures, as \(\left[ {{12} \times 0,{5}\left( {{\text{CU1}}} \right) + {25} \times {1}\left( {{\text{CU2}}} \right) + {4}0 \times {3}\left( {{\text{PCN1}} + {\text{PCN2}}} \right) + {9} \times {5}\left( {{\text{CN1 }} + {\text{ CN2}}} \right)} \right]/{86} = {196}/{86} = {2},{28}\) .
It should be emphasized that the damage information should be viewed with caution because the criteria of various engineers were often subjective and deviated from the evaluation guidelines.
The choice to consider PN1 and PN2 designations, as well as N1 and N2 with the same damage index is also justified. Although the results may not provide an entirely accurate image of the damage in the city, they do provide a reasonable indication of which areas are most vulnerable to earthquakes. The immediate post-earthquake evaluation revealed unique structural damage typologies. Non-structural components such as chimneys and ornamental elements on facades were found to be losing their structural resistance and stability on every structure in the city center. These factors resulted in further damage to the building exterior or structural damage to nearby structures, as well as water intrusion inside the premises. Secondly, the loss of structural strength and stability of structural components jeopardized the structural integrity of entire structures. Gable walls, masonry columns, portions of walls between or under windows, vaults, ceilings, and stairs are the most frequently encountered damaged elements. Some of these features also harmed roof systems, which frequently became unstable because of the collapse of individual load-bearing walls underneath them.
Individual buildings, particularly those within the blocks of buildings, suffered significant damage and had uncertain structural resistance and stability. Table 3 shows the prevalence of observed masonry structure damages and load-deformation in Mila. The structural damage observed is discussed in the following section with graphical interpretations and images of the affected buildings. There are examples of in-plane, out-of-plane, and mixed damage or failure mechanisms.
6.1 Structural damage
Masonry is a well-known heterogeneous, composite material with low tensile strength and significant self-weight, making it difficult to sustain earthquake-induced stresses. Learning from past occurrences can help us design better new structures and make post-earthquake evaluations easier. The Mila earthquake caused damage to clay brick masonry constructions similar to those observed in Japan and Italy (Penna et al. 2014 ; Binda et al. 2000 ; De Luca et al. 2018 ) and Turkey after recent earthquakes (Karimzadeh et al. 2018 ; 2020 ). Most of the residential structures in Mila's old town were constructed with URM. To prevent masonry failure, proper detailing and strengthening should be employed. However, this was not always the case in older structures. Even though “zero mechanism” was frequently mentioned in many post-earthquake evaluations in African nations (i.e., the disintegration of the material) (Indirli et al. 2013 ), due to the construction type, i.e., solid brick structure, this mechanism was not detected during the Mila earthquake. The partial collapse or overturning of gable walls was one of the most typical failure types in Mila's residential structures. Gable walls are often just 9 cm thick. In addition to the attic gable walls, the parapet walls were frequently damaged, but to a lesser extent. The preceding part depicted the roof type, and it was observed that the connections between the timber framework and the walls were frequently insufficient or non-existent. Roof rafters and ridge beams frequently collide with gable walls, causing substantial damage and failure due to their weight and magnified accelerations at the gable's height. The same thing happens with the mezzanine wood structure (which rests on the longitudinal walls) and sidewalls—the wall and horizontal parts are not or are very poorly attached. Figure 14 depicts damage examples from the most prevalent gable wall collapses.

In-plane and out-of plane damage
Many buildings have an architectural design that includes protrusions for entrances or other floor plan irregularities. Cracks frequently emerge at the junction of orthogonal load-bearing walls in these areas; torsion ensues, which can compromise the building's overall stability. Because building entrances with stairs are widespread in these locations, the staircases and related load-bearing walls are frequently damaged. Figure 15 depicts one example.

Plan irregularities caused damage to the connecting components
6.2 Non-structural damages
The Mila earthquake caused the most damage to non-structural elements. Partition walls are typically composed of 9 cm-thick masonry but can be as thin as 3.7 cm without plaster. The degree of damage to partition walls ranges from minor plaster damage to severe collapse and failure (Fig. 16 ). Non-structural walls are sometimes built on the shorter side of the brick (shiner) and are likely to be destroyed after an earthquake. Although damage to partition walls may not result in a permanent reduction in structural strength and stability, it can nonetheless represent a risk to the building's performance and peoples’ safety. Many buildings in Mila have such walls that are exceedingly high and long. This makes them comparatively thin, and their collapse can endanger people. The massive damage to partition walls reflects a major economic loss as well. Certain institutions with huge floor areas have partition walls that have sustained so much damage that cost–benefit assessments have shown that repairing them is not profitable. The building approach was to stack partition walls on top of one other, transferring no load to the slab. If the first-floor wall is destroyed or lost, the weight of the second floor (and higher levels) will be transmitted to the first-floor slab.

Damage to partition walls
Conversion of non-residential spaces to residential spaces is a common adjustment to building spaces (such as basements, attics, or service rooms). Partition walls were frequently eliminated during such renovations, undesired intrusions in load-bearing walls are also common. It is often assumed that if a steel beam is installed on top of the opening to replace the load-bearing wall, nothing will happen to the structure. Elements of the roof structure are frequently removed when transforming an attic into a living area since they interfere with the intended usage (Fig. 17 ). Roof structures have been extensively modified during the conversion of attics to residential use. Timber tie components were frequently cut to install a door (Fig. 17 ), creating significant alterations to the roof structure's basic structural system.

An example of an attic conversion for residential use
Stairs in residential structures are often positioned in the center of the floor layout, with various residential units on either side. Stairs are not necessarily non-structural features, but in the case of brick structures in Mila, they are not critical for seismic force resistance. Stairs can be monolithic at times, although they are usually fixed to the walls on one side and supported by steel profiles on the other. Many stairs lack a supporting beam and are not monolithic, as seen in Fig. 18 (right). Staircase walls are often thicker and part of a rigid core. The most typical staircase damage is the separation of individual stairs, the falling of plaster (sometimes as thick as 3 cm), and the separation of the stairs from the walls (Fig. 18 ).

Typical stairwell damage
Many staircases were built cantilevered into the wall, resulting in substantial step separations during the earthquake. Finally, in older structures, elevator shafts served as partition walls and were frequently damaged (Fig. 19 ).

Typical elevator shaft damage
7 Methodology
7.1 assessment procedure.
A quick, preliminary assessment of the continued useability including all structures affected in the earthquake is the first step in a thorough post-seismic building evaluation (Stepinac et al. 2017 ; Uroš et al. 2020 ). The information thus collected may also be used to evaluate old infrastructure and build a modeling and simulation model. The following studies employed similar technologies (Dall’Asta et al. 2019 ; Betti et al. 2021 ). When required, detailed assessment and available Non-Destructive Testing (NDT) assessment methods are preferred (Stepinac et al. 2020 ). With consideration of the safety of civil engineers in the field, a quick initial survey is carried out as quickly and efficiently as possible following the earthquake. In Algeria, this type of evaluation entailed a quick visual inspection of each load-bearing structural component and an assessment of the level of damage, and the assignment of the building into one of six potential categories (Fig. 20 ):
CU1 Unrestricted use possible (Dark Green label),
CU2 Useful with suggestions (Green label),
PCN1 Unusable for the time being, a thorough examination is essential (Dark Yellow label),
PCN2 temporarily ineffective (Yellow label),
CN1 Due to extraneous influences, it is no longer usable (Dark Red label), and
CN2 Due to damage, it is no longer useable (Red label).

Six categories, each with a unique label
7.2 Detailed assessment results
On August 8, 2020, within the first 24 h after the earthquake, a rapid evaluation of the case study building was conducted. Following a quick thorough observation of load-bearing structural components, the building was deemed temporally uninhabitable (Dark Yellow label), with a suggestion for a further assessment (PCN1). The preliminary assessment's main findings are as follows:
On all levels, there is apparent damage in the form of cracks in the wall coverings, arches (Fig. 21 a), vaults, and ceilings (Fig. 21 b);
Plaster separation and localized damage;
Structural components (walls, columns, and arches) have minor damage;

First floor cracks: wall, lintel ( a ), and ceiling ( b )
In the eastern part of the structure, diagonal cracks are apparent on load-bearing walls.
The second floor and attic had slight damage, but the eastern (Fig. 22 a, b) and central staircase wings received the most serious damage (Fig. 23 a, b). The structure should be used with caution in areas where there is a risk of plaster collapsing, according to the instructions. Furthermore, while the eastern and western stairs can be used with a limited number of people, the central staircase cannot be used until a comprehensive assessment has been conducted.

Exterior a and internal b cracks on the eastern stairwell

Exterior a and internal b diagonal cracks on the central staircase
The buildings under consideration are in the range of peak ground acceleration of 0.199 g, according to current structural engineering standards shown by RPA ( 2003 ), and governmental codes—which means the expected earthquake intensity is X on the EMS-98 scale for a return period of 475 years. Furthermore, a seismic hazard map for the Mila region was developed according to RPA 2003 criteria based on the latest findings from research conducted by CRAAG in collaboration with the University of Skikda (Hamidatou et al. 2017 ). The soil in the immediate area of the evaluated structure falls into the category of soil type C, according to the specified seismic hazard study (2017–2019).
The damage observations are depicted on the building’s floor plans (Figs. 24 and 25 ). The building was evaluated from the air using an unmanned aerial vehicle, and no damage to the primary load-bearing structure or the roof structure was found. Also examined were decorative crosses, figurines, and reliefs. The 3D model of the building was created using photogrammetric photographs for digital preservation reasons.

Damage pattern and shear strength-testing locations on the building's ground floor

Damage pattern and shear strength-testing locations on the first level of the structure
After a detailed assessment of the structure, the following damages were discovered: cracks in wall hangings, vaults, and ceiling, and separation and local degradation of plaster on the bottom floor. Due to lateral motions during the earthquake, cracks in the barrel vaults are frequently parallel to the supporting joints. The cracks are caused by tensile strains that run perpendicular to the supporting joint. If such fissures develop deeply enough, they can induce hinge formation and, as a result, loss of stability. However, the defects found in the studied structure are superficial and mostly concentrated in the plaster. Minor local damage occurred to the structural elements (walls, columns, and arches). Diagonal fractures on load-bearing walls may be seen in the center core of the structure, where the main stairway is located, and in the eastern part of the building. These fissures can also be noticed on the building's north side. All the floors show visible damage, such as cracks and crumbling plaster on the walls. Minor local damage to the first-floor walls, as well as cracks on the partition walls and ceiling connectors, may be seen.
The east wing's ground and first floors were severely damaged. The cracks that developed spread along the entire wall of the wing's south front. It is unfavorable that the fissures are connected and proceed to the transversely interconnected walls and lintels. The little contribution of a torsional reaction of the structure, where the boundary elements are the most strained and collapse might induce such fractures. In addition, that component of the structure is connected to the adjacent structure. Although this can have a favorable impact in general, in the case of the east wing walls, such a boundary condition might produce extra forces. The walls may fail if they are not well connected to the diaphragms. The wall is not in danger of collapsing because there has been no out-of-plane displacement, but it should be strengthened as soon as possible to prevent further damage. Except for the main staircase, the entire structure is available for use. Depending on the probable future, a static and dynamic analysis of the structure's current condition must be done. Irrespective of how much the entire structure would be repaired, the primary staircase, as well as every other wall with cracks along their length, need to be renovated and repaired. Prior to that, preliminary research on the masonry's characteristics and other essential data for the design and analysis must be performed.
7.3 Numerical modeling
The 3Muri software is used to generate a 3D numerical model of the evaluated building. Because of its computational efficiency and excellent accuracy, the macro-element technique is used (Mouyiannou et al. 2014 ).
Its simulation adaptability (including properties of the different elements, realistic floor stiffnesses, strengthening, and many other features) makes it extremely helpful in a location where the great bulk of building stock is brick. This research was based on relevant case analyses in the 3Muri program (Lamego et al. 2017 ; Malcata et al. 2020 ).
The equivalent-frame technique, which employs non-linear beam elements, is used by the macro-element approach. The three categories of macro-elements are piers, spandrels, and stiff nodes (or non-linear beam elements). The piers and spandrels, which are connected by rigid nodes, are the focal points of all deformation. Figure 26 depicts an analogous frame model constructed from these aforementioned macro-elements.

3Muri 3D model and a 3D comparable framework
Non-linear static pushover analysis (Fajfar and Fischinger 1998 ; Cerovecki et al. 2018 ) verifies the limit load ratio employed in numerical solution and provides more comprehensive information on relevant components, failure causes, and the building's overall performance. The pushover study is conducted with constant dynamic loading and monotonically increasing lateral stiffness. Two alternative horizontal load distributions along the building's elevation are investigated in the pushover research. The horizontal load is proportionate to the mass of the building in the first distribution, which also has a high degree of similarity. The horizontal loads are transferred according to the structure's mode pattern in the second distribution first vibration mode form as established by elastic analysis (Figs. 27 and 28 ). Such horizontal forces are imposed in the model at the position of the masses, i.e., at each floor level in the center of the masses. Furthermore, incidental irregularity is carefully considered to account for uncertainty in the determination of the building’s center of mass. For both the x (longitudinal) and y (transversal) directions, 3% of the structure's height perpendicular to the seismic load direction is considered on each side.

Pushover in the y-direction with a mode shape associated with a period of T = 0.26 s

Pushover mode shape in the x-direction, associated with a period T = 0.13 s
In a 3D model, floors are considered as horizontally stiff diaphragms, which is realistic due to the true in-plane rigidity of the horizontal floor elements. In software, rigid diaphragms' in-plane rigidity is limitless, and the mass of the real slab is considered. The roof is removed from the load-bearing structure in the seismic analysis since it has no substantial effect on the structure's reaction and does not contribute to the building's overall resistance. Although it did not meet the criteria, its significance to the model in the form of force was not disregarded.
The numerical model's average values of material parameters (Table 4 ) are based on an analysis of relevant literature (Ghiassi et al. 2019 ; EC06 2021 ) as well as on-site testing. Knowledge level 2 (normal knowledge) can be characterized in terms of experimental in situ testing and extensive study of the structure. The confidence factor was set at 1.2 based on the attained knowledge level.
According to the study in (EC06 2021 ), the building is characterized as normal in height but irregular in floor design, necessitating 3D modeling. The structure is designated as a torsional stiff system. First, static analysis is carried out according to EC06 ( 2021 ) followed by dynamic analysis.
Because seismic resilience is crucial given the consequences of a catastrophe, the pedagogical facility is designated as having relevance class II. As a result, the significance factor is I = 1.2. For two limit states, three PGA values are employed.
The capacity curve represented the ratio of shear force at the structure's base to control node displacement resulting from the seismic analysis. The control node was chosen to be close to the center of mass and is positioned on the building's top story. Figure 29 displays the capacity curves generated from all investigations. Figures 30 and 31 show bi-linearized pushover curves in the x and y axes, respectively. The y-axis shows total base shear in kN, while the x-axis shows control node displacement in mm.

Pushover curves for the x (blue) and y (red) axes

The most relevant pushover curve for the x-direction

The most relevant pushover curve for the y-direction
Figures 32 and 33 show the damaged condition until the last stage of the pushover curves in the x and y-axis, with yellow indicating shear damage and red indicating bending damage.

Damage at maximum displacement capacity for x-direction pushover. Yellow: shear damage, red: bending damage

Damage at maximum displacement capacity for y-direction pushover. Yellow: shear damage, red: bending damage
The structure's capacity is assessed after the structure's response, and inspections are carried out in line with the fundamental standards pertaining to the status of extensive damage, as defined by limit states. Table 5 shows the parameters for similar SDOF systems from Figs. 32 and 33 . These characteristics are determined through bilinearization by employing the associated energy concept that is used to calculate target movement.
The ratio α of the building's limit capacity acceleration to the reference peak ground acceleration on type A ground is also presented in Table 6 . For all limit states, the parameter is provided. An issue emerges with historic masonry structures, which are frequently unable to be strengthened to the extent required to meet today's seismic-resistant construction requirements.
A study of the walls out-of-plane bending must then be performed. This explains the earthquake activity that occurs perpendicular to the walls. The investigation is carried out for the limited situation that is on the verge of collapsing. Acceleration for a 475-year return period is used. If a wall's MRd/MEd ratio is greater than or equal to 1.0, it is considered to have passed the out-of-plane bending test. In Fig. 34 , the walls that failed the examination are shown in red.

Out-of-plane bending findings. Red: bending damage
In the global study, the 3Muri software also does not take the out-of-plane loss of stability into account. It is believed that appropriate connections are created across walls and diaphragms. Out-of-plane local processes are thus avoided, allowing the global in-plane response of the structure to be studied (Lagomarsino et al. 2013 ). Therefore, the resistance to consolidation is put to the test in a specific program unit; specific elements of a single wall are tested, as well as the interaction of parts of many distinct walls that can generate various local mechanisms when combined. A local mechanism is seen in Fig. 35 , with the mechanical component.

Example of a local mechanism
Local mechanisms are arbitrarily established based on the geometry of the building, common failure mechanisms, and seismic damage. Local mechanisms commonly emerge because of faulty wall and wall-to-floor structural connections. The linear kinematic analysis method is applied. There are three phases to defining a local mechanism. To begin, a kinematic block is a stiff wall element that is sensitive to movement or tilting in relation to another block or the whole of the wall. The initial conditions are then found, and the load is finally calculated. Several of the local progressive collapse of the apparent building, as well as its resistance to the types of failure shown, are listed below (Fig. 36 and Table 7 ). The ratio of the response spectrum of mechanical activation to the response spectrum of earthquake excitation is represented by the α parameter.

The local mechanisms LM1 (east wing), LM2 (right wing), and LM3 (left wing) are represented in the diagram (central wing)
8 Discussion and conclusions
Based on case studies from recent seismic events in Japan and Italy, (Da Porto et al. 2013 ; Lucibello et al. 2013 ; Formisano 2017 ; Formisano and Marzo 2017 ; Boschi et al. 2018 ; Chieffo and Formisano 2019 ; Malcata et al. 2020 ), the structure under study was assessed to determine its earthquake resilience. The Mila, Algeria’s recent earthquake damaged the structure. The building was not built according to seismic design principles. However, the repair and retrofit improved the structure's condition. Transverse walls are added, and old timber beams are replaced with reinforced concrete flooring. Such stiff diaphragms provide a good connection between all walls and, as a result, improved the seismic behavior of the structure. Therefore, enhancing the rigidity of conventional timber flooring in ancient brick buildings is frequently one of the first seismic retrofitting procedures. On the other hand, a recent study shows that replacing traditional hardwood floors with rigid diaphragms, such as RC flooring, improves energy efficiency. Cracks on the edges of the two materials, or, in the worst-case scenario, disintegration, and collapse of the masonry walls, might be the consequence. This strategy, however, is effective for earthquakes of expected smaller magnitudes, such as those in Mila, and serves to reinforce the existing structure against horizontal actions.
We described the damage to Mila's historic downtown following the earthquake on August 7, 2020. Despite previous calls from the scientific and technical communities, the earthquake demonstrated and verified that awareness, vulnerability mitigation, and readiness are critical to preventing catastrophic seismic consequences and enabling timely action after an earthquake. Although of low magnitude, the Mila earthquake inflicted major damage and economic loss, as well as exposed many weaknesses in the built heritage that people, decision-makers, and the professional and scientific community will have to address for many years to come. The earthquake severely destroyed older masonry structures built before seismic standards were enforced.
The information obtained during the rapid post-earthquake assessment was analyzed and discussed. Damages are graphically shown and illustrated by images. This report examines preliminary data from the database that was enhanced by field engineers. Forms for rapid post-earthquake building evaluation were developed shortly after the 1980 earthquake, and similar forms were used after subsequent earthquakes such as the Tipaza and Zemmouri earthquakes. The findings of the rapid evaluations must be calibrated and reconciled with the extensive reviews provided by the new Act for the rehabilitation of Mila city. In the impacted region, 1044 structures have been identified as severely damaged and will be submitted to further inspections.
3 Muri and an analogous frame approach were used to analyze the existing unconfined masonry structure. Because of its multiple advantages, non-linear static (pushover) seismic analysis is used instead of linear seismic analysis. For the 100, 225, and 475-year return periods, limit state checks were performed. In terms of the structure's existing wall distribution, the results are consistent with the expected behavior. The construction becomes less stiff and has higher displacements in the y direction. Furthermore, the structure's capacity is reduced in the y-direction. There is also some irregularity between the centers of stiffness and mass, which causes torsion to have a minor but unfavorable influence on the overall behavior of the structure. The middle stairwell's walls, as well as the west side of the structure’s cross walls, are crucial elements. Out-of-plane bending failure of walls was also investigated. Using linear kinematics, the causes of failure mode were also examined. The actual damage was compared to the damage calculated using the 3Muri software's non-linear static seismic analysis. From the examination of the structure's behavior during an earthquake, it is evident that strengthening is necessary to improve the structure's seismic performance. An earthquake's damage must be repaired to avoid future damage and threat to the structure's overall strength and stability.
The main results of the investigated area of the city are that the damaged structures are typically older and were built before seismic regulations were implemented. The building materials have degraded over time. Furthermore, the structures are typically under-maintained and, in many cases, designed as seismically deficient. Local (rather than global) in-plane and out-of-plane mechanisms were the most typical failure modes. Significant damage has been found in secondary and/or ornamental building components. Buildings collapsing all at once were extremely infrequent. Aside from concerns with the existing susceptible building stock built prior to seismic regulations, the amount of damage was compounded owing to unlawful conversion of ground levels for commercial activity. There appears to be a widespread lack of understanding and perception of seismic danger in the population, as well as a lack of preventative information dissemination aimed at boosting awareness.
As a result of the several devastating earthquakes that have struck Algeria, the ability to 'build back better’ is much valued. This involves using sustainable resources and producing new ideas (Funari et al. 2020 , 2021 ; Stepinac et al. 2020 ) should be implemented, and energy efficiency should be ensured (Milovanovic and Bagaric 2020 ; Valluzzi et al. 2021 ). Buildings made of masonry can be strengthened using a variety of techniques (Ortega et al. 2017 ; Kouris and Triantafillou 2018 ; Skejic et al. 2020 ). Due to their compatibility and reversibility, materials like FRP (Fiber-Reinforced Polymers) and TRM (Textile-Reinforced Mortars) can be used.
Data availability
All data generated or analyzed during this study are included in this article.
Akkouche K, Hannachi NE, Hamizi M et al. (2019) Knowledge-based system for damage assessment after earthquake: Algerian buildings case. Asian J Civ Eng 20:769–784. https://doi.org/10.1007/s42107-019-00143-z
Article Google Scholar
Allali SA, Abed M, Mebarki A (2018) Post-earthquake assessment of buildings damage using fuzzy logic. Eng Struct 166:117–127. https://doi.org/10.1016/j.engstruct.2018.03.055
Amari K, Abdessemed F, Cheikh Zouaoui M, Uva G (2020) Seismic vulnerability of masonry lighthouses: a study of the bengut lighthouse, Dellys, Boumerdès, Algeria. Buildings 10:247. https://doi.org/10.3390/buildings10120247
ARES (2021) Project first Workshop. Available online: www.grad.hr/ares (Accessed on 15 Feb 2021)
Atalić J, Šavor Novak M, Uroš M (2019) Seismic risk for Croatia: overview of research activities and present assessments with guidelines for the future. Građevinar 71(10):923–947
Google Scholar
Athmania D, Benaissa A, Hammadi A, Bouassida M (2010) Clay and marl formation susceptibility in Mila Province. Algeria Geotech Geol Eng 28(6):805–813. https://doi.org/10.1007/s10706-010-9341-5
Baggio C, Bernardini A, Colozza R, Corazza L, Bella M, Di Pasquale G, Dolce M, Goretti A, Martinelli A, Orsini G et al. (2007) Field manual for post-earthquake damage and safety assessment and short-term countermeasures (AeDES), JRC Sci, Thechnical Reports. 1–100
Bechtoula H, Ousalem H (2005) The 21 May 2003 Zemmouri (Algeria) earthquake: damages and disaster responses. J Adv Concr Technol 3(1):161–174
Belazougui M (2008) Boumerdes Algeria earthquake of May 21, 2003: damage analysis and behavior of beam-column reinforced concrete structures. In: proceedings of the 14th world conference on earthquake engineering, Beijing, Paper 14_01–1006
Benfedda A, Serkhane A, Bouhadad Y, Slimani A, Abbouda M, Bourenane H (2021) The main events of the July-August 2020 Mila (NE Algeria) seismic sequence and the triggered landslides. Arab J Geosci 14:1894. https://doi.org/10.1007/s12517-021-08301-x
Betti M, Bonora V, Galano L, Pellis E, Tucci G, Vignoli A (2021) An integrated geometric and material survey for the conservation of heritage masonry structures. Heritage 4:35
Bialas J, Oommen T, Rebbapragada U, Levin E (2016) Object-based classification of earthquake damage from high-resolution optical imagery using machine learning. J Appl Remote Sens 10(03):036025
Binda L, Saisi A, Tiraboschi C (2000) Investigation procedures for the diagnosis of historic masonries. Constr Build Mater 14(4):199–233. https://doi.org/10.1016/S0950-0618(00)00018-0
Boschi S, Borghini A, Pintucchi B, Bento R, Milani G (2018) Seismic vulnerability of historic masonry buildings: a case study in the center of Lucca. Procedia Struct Integr 11:169–176
Boukri M, Farsi MN, Mebarki A, Belazougui M (2013) Development of an integrated approach for Algerian building seismic damage assessment. Struct Eng Mech 47(4):471–493. https://doi.org/10.12989/SEM.2013.47.4.471
Boulahia O (2022) Identification, characterization and interaction of seismic sources: Implication on sequences of seismic events of the period 2010–2021 in the North-East of Algeria Doctoral thesis at Sétif University. http://dspace.univ-setif.dz:8888/jspui/handle/123456789/3956
Bounemeur N, Benzaid R, Kherrouba H et al. (2022) Landslides in Mila town (northeast Algeria): causes and consequences. Arab J Geosci 15:753. https://doi.org/10.1007/s12517-022-09959-7
Bounif MA, Haessler H, Meghraoui M (1987) The Constantine earthquake of October 27, 1985: surface ruptures and aftershock study. Earth Planet Sci Lett 85:451–460
Casapulla C, Argiento LU, Maione A (2018) Seismic safety assessment of a masonry building according to Italian Guidelines on cultural heritage: simplified mechanical-based approach and pushover analysis. Bull Earthq Eng 16:2809–2837
Cerovecki A, Kraus I, Moric D (2018) N2 building design method. Gradjevinar 70:509–518
Chieffo N, Formisano A (2019) Comparative seismic assessment methods for masonry building aggregates: a case study. Front Built Environ 5:123
Chimouni R, Harbi A, Boughacha MS, Hamidatou M, Kherchouche R, Sebaï A (2018) The 1790 Oran earthquake, a seismic event in times of conflict along the Algerian coast: a critical review from western and local source materials. Seismol Res Lett 89(6):2392–2403. https://doi.org/10.1785/0220180175
Coiffait PE (1992) A post-nappe basin in its structural framework: The example of the Constantine basin (North-East Algeria). Dessertation, University of Nancy
Da Porto F, Munari M, Prota A, Modena C (2013) Analysis and repair of clustered buildings: case study of a block in the historic city center of L’Aquila (Central Italy). Constr Build Mater 38:1221–1237
Dall’Asta A, Leoni G, Meschini A, Petrucci E, Zona A (2019) Integrated approach for seismic vulnerability analysis of historic massive defensive structures. J Cult Herit 35:86–98
De Luca FGED, Woods C, Galasso D, D’Ayala RC (2018) In filled building performance against the evidence of the 2016 EEFIT Central Italy post-earthquake reconnaissance mission: empirical fragilities and comparison with the FAST method. Bull Earthq Eng 16(7):2943–2969. https://doi.org/10.1007/s10518-017-0289-1
Didier M, Baumberger S, Tobler R, Esposito S, Ghosh S, Stojadinovic B (2017) Improving post-earthquake building safety evaluation using the 2015 Gorkha, Nepal, Earthquake rapid visual damage assessment data. Earthq Spectra 33:415–438
Durand DM (1969) Focus on the structure of the Northeast of the BERBERIE. Bull Serv Carte Geol Agerie NS 39:89–131
EMS (1998) Comision Sismologica Europea, Escala Macro Sísmica Europea EMS 98(15)
Endo Y, Pelà L, Roca P (2017) Review of different pushover analysis methods applied to masonry buildings and comparison with nonlinear dynamic analysis. J Earthq Eng 21:1234–1255
Eurocode 6 (2021) Design of masonry structures—Part 1–1: general rules for reinforced and unreinforced masonry structures. Available online: https://www.phd.eng.br/wp-content/uploads/2015/02/en.1996.1.1.2005.pdf
Eurocode 8 (2004a): Design of structures for earthquake resistance—Part 1: general rules, seismic actions and rules for buildings. EN 1998–1: European Committee for Standardization, Brussels. https://www.phd.eng.br/wp-content/uploads/2015/02/en.1998.1.2004a.pdf
Eurocode 8 (2004b) Design of structures for earthquake resistance—Part 3: assessment and retrofitting of buildings. Available online: https://www.phd.eng.br/wp-content/uploads/2014/07/en.1998.3.2005.pdf
Fajfar P, Fischinger M (1998) N2—a method for non-linear seismic analysis of regular buildings. In: proceedings of the 9th world conference in earthquake engineering, Tokyo-Kyoto, Japan, 2–9 August 1998, pp 111–116
Farsi MN, Belazougui M (1992) The Mont Chenoua (Algeria) earthquake of October 29th 1989; damage assessement and distribution", Proceedings of the 10th world conference on earthquake engineering, Madrid, Spain
Formisano A (2017) Theoretical and numerical seismic analysis of masonry building aggregates: case studies in San Pio Delle Camere (L’Aquila, Italy). J Earthq Eng 21:227–245
Formisano A, Marzo A (2017) Simplified and refined methods for seismic vulnerability assessment and retrofitting of an Italian cultural heritage masonry building. Comput Struct 180:13–26
Funari MF, Mehrotra A, Lourenço PB (2021) A tool for the rapid seismic assessment of historic masonry structures based on limit analysis optimisation and rocking dynamics. Appl Sci 11:942
Funari MF, Spadea S, Lonetti P, Fabbrocino F, Luciano R (2020) Visual programming for structural assessment of out-of-plane mechanisms in historic masonry structures. J Build Eng 31:101425
Ghiassi B, Vermelfoort AT, Lourenço PB (2019) Masonry Mechanical Properties. In: Numerical modeling of masonry and historical structures. Woodhead Publishing, pp 239–261
Grillanda N, Valente M, Milani G, Chiozzi A, Tralli A (2020) Advanced numerical strategies for seismic assessment of historical masonry aggregates. Eng Struct 212:110441
Guemache MA, Machane D, Beldjoudi H, Gharbi S, Djadia L, Benahmed S, Ymmel H (2010) On a damaging earthquake-induced landslide in the Algerian Alps: the March 20, 2006 Laâlam landslide (Babors chain, northeast Algeria), triggered by the Kherrata earthquake (Mw = 5 3). Nat Hazards 54(2):273–288. https://doi.org/10.1007/s11069-009-9467-z
Halla N, Hamidatou M, Hamai L, Atmane L, Yelles chaouche A (2022) Earthquake induced landslide in Milla region: the August 07, 2020 (El-Kherba, Grarem-Gouga and Azzeba) landslides Northeast Algeria, triggered by the Mila earthquake (Mw = 5). In process for publication, Naturals hazards journal
Hamidatou M, Mohammedi Y, Hallal N, Yelles-Chaouche A, Lebdioui S, Thallak I, Stromeyer D, Khemici O (2021) Reply to the comment on the paper “seismic hazard analysis of surface level, using topographic condition in Northeast of Algeria” by Mohamed Hamdache and José A. Pelàez. Pure Appl Geophys 178:305–312. https://doi.org/10.1007/s00024-020-02644-4
Hamidatou M, Mohammedi Y, Yelles-Chaouche A, Thallak I, Stromeyer D, Lebdioui S, Cotton F, Hallal N, Khemici O (2019) Seismic hazard analysis of surface level, using topographic condition in the Northeast of Algeria. Pure Appl Geophys 178(3):823–846. https://doi.org/10.1007/s00024-019-023104
Hamidatou M, Sbartai B (2016) Deterministic assessment of seismic risk in Constantine city, Northeast Algeria. Nat Hazards 86(2):441–464. https://doi.org/10.1007/s11069-016-2693-2
Hamidatou M, Sbartai B (2017) Probabilistic seismic hazard assessment in the Constantine region, Northeast of Algeria. Arab J Geosci 10(6):1–20. https://doi.org/10.1007/s12517017-2876-5
Harbi A, Maouche S, Ousadou F, Rouchiche Y, Yelles-Chaouche A, Merahi M, Heddar A, Nouar O, Kherroubi A, Beldjoudi H, Ayadi A, Benouar D (2007) Macroseismic study of the Zemmouri earthquake of 21 May 2003 (Mw 6.8, Algeria). Earthq Spectra 23(2):315–332
Harbi A, Maouche S, Vaccari F, Aoudia A, Oussadou F, Panza GF, Benouar D (2007b) Seismicity, seismic input and site effects in the Sahel-Algiers Region (North Algeria). Soil Dyn Earth Eng 27(5):427–447
Harbi A, Meghraoui M, Maouche S (2011) The Djidjelli (Algeria) earthquakes of 21 and 22 August 1856 (I0 VIII, IX) and related tsunami effects Revisited. J Seismol 15:105–129. https://doi.org/10.1007/s10950-010-9212-9
Hellel M, Chatelain JL, Guillier B, Machane D, Ben Salem R, Oubaiche E, Haddoum H (2010) Heavier damages without site effects and site effects with lighter damages: Boumerdes City (Algeria) after the May 2003 earthquake. Seismol Res Lett 81(1):37–43. https://doi.org/10.1785/gssrl.81.1.37
Hichem N, Ahmed M, Mohamed A (2019) Post-quake structural damage evaluation by neural networks: theory and calibration. Eur J Environ Civ Eng 23:710–727. https://doi.org/10.1080/19648189.2017.1304277
Indirli MS, Kouris LA, Formisano L, Borg RP, Mazzolani FM (2013) Seismic damage assessment of unreinforced masonry structures after the abruzzo 2009 earthquake: the case study of the historical centers of L’Aquila and castelvecchio subequo. Int J Architect Herit 7(5):536–578. https://doi.org/10.1080/15583058.2011.654050
Karimzadeh S, Askan A, Erberik MA, Yakut A (2018) Seismic damage assessment based on regional synthetic ground motion dataset: a case study for Erzincan, Turkey. Nat Hazards 92(3):1371–1397
Karimzadeh S, Kadas K, Askan A, Erberik MA, Yakut A (2020) Derivation of analytical fragility curves using SDOF models of masonry structures in Erzincan (Turkey). Earthq Struct 18(2):249–261
Kim T, Song J, Kwon OS (2020) Pre- and post-earthquake regional loss assessment using deep learning. Earthq Eng Struct Dyn 49:657–678
Kouris LAS, Triantafillou TC (2018) State-of-the-art on strengthening of masonry structures with textile reinforced mortar (TRM). Constr Build Mater 188:1221–1233
Lagomarsino S, Penna A, Galasco A, Cattari S (2013) TREMURI program: an equivalent frame model for the nonlinear seismic analysis of masonry buildings. Eng Struct 56:1787–1799
Lamego P, Lourenço PB, Sousa ML, Marques R (2017) Seismic vulnerability and risk analysis of the old building stock at urban scale: application to a neighbourhood in Lisbon. Bull Earthq Eng 15:2901–2937
Laouami N, Slimani A, Larbes S (2018) Ground motion prediction equations for Algeria and surrounding region using site classification based H/V spectral ratio. Bull Earthq Eng 16(7):2653–2684. https://doi.org/10.1007/s10518-018-0310-3
Laouami N, Slimani N, Bouhadad Y, Chatelain JL, Nour A (2006) Evidence for fault-related directionality and localized site effects from strong motion recordings of the 2003 Boumerdes (Algeria) earthquake: consequences on damage distribution and the Algerian Seismic Code. Soil Dyn Earth Eng 26:991–1003. https://doi.org/10.1016/j.soildyn.2006.03.006
Lourenco P, Karanikoloudis G (2019) Seismic behavior and assessment of masonry heritage structures. Needs in engineering judgement and education. RILEM Tech Lett 3:114–120
Lucibello G, Brandonisio G, Mele E, De Luca A (2013) Seismic damage and performance of Palazzo Centi after L’Aquila earthquake: a paradigmatic case study of effectiveness of mechanical steel ties. Eng Fail Anal 34:407–430
Malcata M, Ponte M, Tiberti S, Bento R, Milani G (2020) Failure analysis of a Portuguese cultural heritage masterpiece: Bonet building in Sintra. Eng Fail Anal 115:104636
Marmi R, Kacimi M, Boularak M (2008) Landslides in the Mila region (North-Eastern Algeria): impact on infrastructure. Revista De Geomorphologie 10:51–56
Marshall JD, Jaiswal K, Gould N, Turner F, Lizundia B, Barnes JC (2013) Post-earthquake building safety inspection: lessons from the canterbury, New Zealand, earthquakes. Earthq Spectra 29:1091–1107
Medhat NI, Yamamoto M-Y, Tolomei C, Harbi A, Maouche S (2022) Multi-temporal InSAR analysis to monitor landslides using the small baseline subset (SBAS) approach in the Mila Basin, Algeria, Terra Nova published by John Wiley & Sons Ltd. https://doi.org/10.1111/ter.12591
Mehani Y, Bechtoula H, Kibboua A, Naili M (2013) Assessment of seismic fragility curves for existing RC buildings in Algiers after the 2003 Boumerdes earthquake. Struct Eng Mech 46(6):791–808. https://doi.org/10.12989/SEM.2013.46.6.791
Merghadi A, Abderrahmane B, Tien Bui D (2018) Landslide susceptibility assessment at Mila Basin (Algeria): a comparative assessment of prediction capability of advanced machine learning methods. ISPRS Int J Geo Inf 7(7):268. https://doi.org/10.3390/ijgi7070268
Meslem A, Yamazaki F, Maruyama Y, Benouar D, Kibboua A, Mehani Y (2012) The effects of building characteristics and site conditions on the damage distribution in Boumerdès after the 2003 Algeria earthquake. Earthq Spectra 28(1):185–216. https://doi.org/10.1193/1.3675581
Milovanovic B, Bagaric M (2020) How to achieve nearly zero-energy buildings standard. Gradjevinar 72:703–720
Mouyiannou A, Rota M, Penna A, Magenes M (2014) Identification of suitable limit states from nonlinear dynamic analyses of masonry structures. J Earthq Eng 18:231–263
Naito S, Tomozawa H, Mori Y, Nagata T, Monma N, Nakamura H, Fujiwara H, Shoji G (2020) Building-damage detection method based on machine learning utilizing aerial photographs of the Kumamoto earthquake. Earthq Spectra 36:1166–1187
Ortega J, Vasconcelos G, Rodrigues H, Correia M (2018) Assessment of the influence of horizontal diaphragms on the seismic performance of vernacular buildings. Bull Earthq Eng 16:3871–3904
Ortega J, Vasconcelos G, Rodrigues H, Correia M, Ferreira TM, Vicente R (2019) Use of post-earthquake damage data to calibrate, validate and compare two seismic vulnerability assessment methods for vernacular architecture. Int J Disaster Risk Reduct 39:101242
Ortega J, Vasconcelos G, Rodrigues H, Correia M, Lourenço PB (2017) Traditional earthquake resistant techniques for vernacular architecture and local seismic cultures: a literature review. J Cult Herit 27:181–196. https://doi.org/10.1016/j.culher.02.015
Ousadou F, Dorbath L, Dorbath C, Bounif MA, Benhallou H (2012) The Constantine (Algeria) seismic sequence of 27 October 1985: a new rupture model from aftershock relocation, focal mechanisms, and stress tensors. J Seismol 17(2):207–222
Palazzi NC, Barrientos M, Sandoval C de la Llera JC (2022) Seismic Vulnerability Assessment of the Yungay's Historic Urban Center in Santiago, Chile. J Earthq Eng 1–28
Penna AP, Morandi M, Rota CF, Manzini F, Da Porto G (2014) Magenes, Performance of masonry buildings during the Emilia 2012 earthquake. Bull Earthq Eng 12(5):2255–2273. https://doi.org/10.1007/s10518-013-9496-6
Raoult JF (1974) Geology of the Center of the numidic chain (North Constantinois, Algeria). Thesis Paris Mem Soc Geol 121: 63
Remki M, Benouar D (2014) Damage potential and vulnerability functions of strategic buildings in the city of Algiers. KSCE J Civ Eng 18:1726–1734. https://doi.org/10.1007/s12205-014-0184-0
Rodríguez AS, Rodríguez BR, Rodríguez MS, Sánchez PA (2019) 9-Laser scanning and its applications to damage detection and monitoring in masonry structures. In: Ghiassi B, Lourenço PB (eds) Woodhead Publishing Series in Civil and Structural Engineering, Long-term Performance and Durability of Masonry Structures, Woodhead Publishing, pp 265–285
RPA (2003) Algerian Earthquake Rules 1999. Version 2003. National Center of Applied Research in Earthquake Engineering (CGS)
Semmane F, Abacha I, Yelles-Chaouche AK et al. (2012) The earthquake swarm of December 2007 in the Mila region of northeastern Algeria. Nat Hazards 64:1855–1871. https://doi.org/10.1007/s11069-012-0338-7
Skejic D, Lukacevic I, Curkovic I, Cudina I (2020) Application of steel in refurbishment of earthquake-prone buildings. Gradjevinar 72:955–966
Smail T, Abed M, Mebarki A, Lazecky M (2022) Earthquake-induced landslide monitoring and survey by means of InSAR. Nat Hazards Earth Syst Sci 22:1609–1625. https://doi.org/10.5194/nhess-22-1609-2022
Stepinac M, Gašparovic M (2020) A review of emerging technologies for an assessment of safety and seismic vulnerability and damage detection of existing masonry structures. Appl Sci 10:5060
Stepinac M, Kisicek T, Renic T, Hafner I, Bedon C (2020) Methods for the assessment of critical properties in existing masonry structures under seismic loads-The ARES project. Appl Sci 10(5):1576. https://doi.org/10.3390/app10051576
Stepinac M, Rajcic V, Barbalic J (2017) Inspection and condition assessment of existing timber structures. Gradjevinar 69:861–873
Tebbouche MY, Ait Benamar D, Hassan HM et al. (2022) Characterization of El Kherba landslide triggered by the August 07, 2020, Mw = 4.9 Mila earthquake (Algeria) ambient noise analysis. Environ Earth Sci 81:46. https://doi.org/10.1007/s12665-022-10172-8
Uroš M, Šavor Novak M, Atalc J, Sigmund Z, Banicek M, Demšic M, Hak S (2020) Post-earthquake damage assessment of buildings–procedure for conducting building inspections. Gradjevinar 72:1089–1115
Valente M, Milani G (2019) Damage assessment and collapse investigation of three historical masonry palaces under seismic actions. Eng Fail Anal 98:10–37
Valluzzi MR, Salvalaggio M, Croatto G, Dorigatti G, Turrini U (2021) Nested buildings: an innovative strategy for the integrated seismic and energy retrofit of existing masonry buildings with CLT panels. Sustainability 13:1188
Vila JM (1980) Geological map at 1/50.000. Dissertation, University of Paris VI
Vlachakis G, Vlachaki E, Lourenço PB (2020) Learning from failure: damage and failure of masonry structures, after the 2017 lesvos earthquake (Greece). Eng Fail Anal 117:104803. https://doi.org/10.1016/j.engfailanal
Yavari S, Chang SE, Elwood KJ (2010) Modeling post-earthquake functionality of regional health care facilities. Earthq Spectra 26:869–892
Zhang Y, Burton HV, Sun H, Shokrabadi M (2018) A machine-learning framework for assessing post-earthquake structural safety. Struct Saf 72:1–16
Download references
This paper did not receive any funding.
Author information
Authors and affiliations.
Research Center in Astronomy, Astrophysics and Geophysics, BP 63, 16340, Bouzaréah, Algiers, Algeria
Hamidatou Mouloud & Hallal Nassim
The Engineering Mechanics Institute, American Society of Civil Engineers, Reston, USA
Amar Chaker
Faculty of Technology, University of August 20, 1955-Skikda, P. O. Box 26, 21000, Skikda, Algeria
Saad Lebdioui
Civil Engineering Department, University of Aveiro, Campus Universitário de Santiago, RISCO, 3810-193, Aveiro, Portugal
Hugo Rodrigues
Dipartiment tal-Ġeoxjenza, Fakultà tax-Xjenza, L-Università ta’ Malta, Msida, Malta
Matthew R. Agius
You can also search for this author in PubMed Google Scholar
Corresponding author
Correspondence to Hamidatou Mouloud .
Ethics declarations
Conflict of interest.
The authors declare no conflict of interest. The funders had no role in the design of the study; in the collection, analyses, or interpretation of data; in the writing of the manuscript, or in the decision to publish the results.
Additional information
Publisher's note.
Springer Nature remains neutral with regard to jurisdictional claims in published maps and institutional affiliations.
Rights and permissions
Springer Nature or its licensor (e.g. a society or other partner) holds exclusive rights to this article under a publishing agreement with the author(s) or other rightsholder(s); author self-archiving of the accepted manuscript version of this article is solely governed by the terms of such publishing agreement and applicable law.
Reprints and permissions
About this article
Mouloud, H., Chaker, A., Nassim, H. et al. Post-earthquake damage classification and assessment: case study of the residential buildings after the M w = 5 earthquake in Mila city, Northeast Algeria on August 7, 2020. Bull Earthquake Eng 21 , 849–891 (2023). https://doi.org/10.1007/s10518-022-01568-9
Download citation
Received : 28 June 2022
Accepted : 09 November 2022
Published : 21 November 2022
Issue Date : January 2023
DOI : https://doi.org/10.1007/s10518-022-01568-9
Share this article
Anyone you share the following link with will be able to read this content:
Sorry, a shareable link is not currently available for this article.
Provided by the Springer Nature SharedIt content-sharing initiative
- Vulnerability
- Residential building
- Classification
- Post-earthquake
- Find a journal
- Publish with us
- Track your research
The Parkfield, California, Earthquake Experiment
September 28, 2004— m 6.0 earthquake captured.
The Parkfield Experiment is a comprehensive, long-term earthquake research project on the San Andreas fault. Led by the USGS and the State of California, the experiment's purpose is to better understand the physics of earthquakes - what actually happens on the fault and in the surrounding region before, during and after an earthquake. Ultimately, scientists hope to better understand the earthquake process and, if possible, to provide a scientific basis for earthquake prediction. Since its inception in 1985, the experiment has involved more than 100 researchers at the USGS and collaborating universities and government laboratories. Their coordinated efforts have led to a dense network of instruments poised to "capture" the anticipated earthquake and reveal the earthquake process in unprecedented detail.
Moderate-size earthquakes of about magnitude 6 have occurred on the Parkfield section of the San Andreas fault at fairly regular intervals - in 1857, 1881, 1901, 1922, 1934, and 1966. The first, in 1857, was a foreshock to the great Fort Tejon earthquake which ruptured the fault from Parkfield to the southeast for over 180 miles. Available data suggest that all six moderate-sized Parkfield earthquakes may have been "characteristic" in the sense that they all ruptured the same area on the fault. If such characteristic ruptures occur regularly, then the next quake would have been due before 1993.
These pages describe the scientific background for the experiment, including the tectonic setting at Parkfield, the historical earthquake activity on this section of the San Andreas fault, the monitoring and data collecting activities currently being carried out, and plans for future research. Data are available to view in real-time and download.
Scientific Advances
While the greatest scientific payoff is expected when the earthquake occurs, our understanding of the earthquake process has already been advanced through research results from Parkfield. Some of the highlights are described.
Real-time data from instrumentation networks running at Parkfield are available for viewing and downloading.
Parkfield Earthquake Shake Table Exhibit
The Art-Science of Earthquakes by D.V. Rogers November 23, 2009 ( video )
The exhibit was a geologically interactive, seismic machine earthwork temporarily installed in Parkfield in 2008. Rogers presented the history, conceptual premise, documentation of the work, and also put forward the idea of how early 21st century cultural practice could be used to encourage earthquake awareness and preparedness.
Pictures and interactive, 360-degree panorama .
Lessons From the Best-Recorded Quake in History
USGS Public Lecture by Andy Michael October 26, 2006 ( video )
New data from the 2004 Parkfield earthquake provide important lessons about earthquake processes, prediction, and the hazards assessments that underlie building codes and mitigation policies.

Research Scientist: John Langbein , Earthquake Science Center.
- Español (Spanish)
- Français (French)
- Bahasa Indonesia (Indonesian)
- Brasil (Portuguese)
- हिंदी (Hindi)
A wake-up jolt? Assam’s 6.4 quake exposes its vulnerabilities
- A 6.4 magnitude earthquake, measured on the Richter scale, rocked Assam in the early hours of April 28 this year. Two people died of shock and there was a lot of damage to property. There were at least 20 aftershocks.
- Soil liquefaction, when water seeps from the ground, was seen in places near the epicentre, near Dhekiajuli in the Sonitpur district.
- Scientists point that anthropogenic factors could contribute to earthquake triggers, although of smaller magnitude.
- More stringent monitoring of construction activities to ensure that the seismic code of safety is followed and awareness among people, are ways to mitigate the rising vulnerability of Assam as it lies in the highest seismic hazard zone.
When a strong, 6.4 magnitude earthquake shook Assam on April 28 this year, there was panic and mayhem. The earth cracked near the epicentre in the Sonitpur district, and so did walls and ceilings of people’s houses scores of miles in the radius; buildings swayed “like betel nut trees in the wind”, a hill broke down, and water seeped out of paddy fields. Already under the siege of the second wave of the COVID-19 pandemic, the earthquake — and the multiple aftershocks through the day — unleashed fear. Two people died of shock and there were several reports of considerable damage to houses and buildings. It also exposed, once again, the vulnerability of Assam to seismic activity and how anthropogenic activities could be further contributing to it.
Assam, and the entire northeast India, is categorised under seismic zone 5 , which means it’s extremely prone to high-intensity earthquakes. On April 28, the 6.4 magnitude earthquake measured on the Richter scale, was followed by 20 aftershocks of different magnitudes through the day, according to Gyanendra Dev Tripathi, CEO of Assam State Disaster Management Authority (ASDMA). Six aftershocks, of magnitude 3.2 to 4.7, occurred within hours of the main tremor. The National Centre for Seismology (NCS) has in fact continued to record seismic activity of magnitude 2.6-2.7 in the region on the eighth day of the main tremor.
The main tremor, said the NCS, occurred near the Kopili Fault, close to the Himalayan Frontal Thrust (HFT) which is a seismically very active area “associated with collisional tectonics where Indian plane sub-ducts beneath the Eurasian Plate”. A fault , according to the United States Geological Survey (USGS) “is a fracture or zone of fractures between two blocks of rocks. Faults allow the blocks to move relative to each other.” The Kopili fault is a 300 km northwest-southeast trending fault from the Bhutan Himalaya to the Burmese arc.
Earthquakes and Assam’s vulnerability
Earthquakes are not uncommon in Assam, with the NCS saying that the region has seen several moderate to high-intensity earthquakes. One of the worst among them was the great Assam-Tibet earthquake in 1950 which measured 8.6 magnitude on the Richter scale. Approximately 4,800 people were killed as a result, and there were several landslides that blocked the tributaries of the Brahmaputra and changed the topography of the region. The 1869 Cachar earthquake, measuring 7.4 magnitude, was another major seismic activity to hit the region.
Experts have said that recent seismicity discovered along the Kopili fault had led to speculations that it is one of the most seismically active faults of the region. A large portion of the Kopili fault region, said scientist Nilutpal Bora, and its neighbouring areas are characterised by alluvial soil that has a higher potential of trapping seismic waves and therefore making it one of the most earthquake-prone zones in northeast India.
“Assam, being located in the highest seismic zone, is perpetually challenged by the possibility of occurrence of earthquakes as an expression of release of accumulated tectonic stress,” Chandan Mahanta, professor in the department of civil engineering, Indian Institute of Technology (IIT) Guwahati, told Mongabay-India. Continuous tectonic stress keeps building up along the fault lines, he said, and the 6.4 magnitude tremor was a release of such accumulated stress.

One thing leads to the other
High-intensity tremors aside, the region is vulnerable to seismic activity of different magnitude and intensity. This, said Mahanta, could be a contributing factor to erosion, since “seismic activity can disturb earth material properties, like strength and cohesion, and slope instability adds to this”.
Images of a portion of a hill breaking and falling into a river in the Udalguri district following the 6.4 magnitude tremor showcased to the rest of the world the intensity of the quake. The 1950 quake had led to many landslides and Mahanta said that apart from the major quakes mentioned, “many landslides are seismologically induced”. This means that seismic activity has a role to play in adding sediment load to the Brahmaputra river. “Landslides in upper Brahmaputra are known to add high sediment load to the river,” Mahanta said.
This is significant because a high sediment load on the Brahmaputra is known to cause recurrent floods since the river bed rises and the width of the river increases. Dredging of the river, the Assam government has long said, is a solution to this problem, allocating huge amounts of funds to this end. In 2017, union minister of transport, Nitin Gadkari, had announced Rs 250 crores for dredging the Brahmaputra. Experts, however, opine that dredging the entire river is neither a feasible nor a permanent solution since the silt makes its way back after being removed.
When water guzzled out of the earth
This April’s tremor also led to a seemingly ‘strange’ event: of water springing out of paddy fields, close to the epicentre, near Dhekiajuli, in Assam. A video of this was shared on social media by the present state chief minister Himanta Biswa Sarma. Scientists call this phenomenon, soil liquefaction. By definition, it means when saturated or partially saturated soil substantially loses strength and stiffness in response to applied stress, like the shake of an earthquake.
And in this case, Vineet Gahalaut, chief scientist, CSIR-National Geophysical Research Institute, said it was nothing out of the ordinary particularly because “it is common in places with shallow water table”.
“In 2017, the Manu earthquake in Tripura caused soil liquefaction till Bangladesh. And its magnitude was 5.7 on the Richter scale,” Gahalaut said.
Anthropogenic factors at play?
What should be considered more importantly, is the possibility of anthropogenic factors impacting seismic activity. “Whether anthropogenic factors can cause an earthquake of this magnitude (6.4) is difficult to establish. But there have been few cases in the US, where seismic monitoring is good, where it has been seen that anthropogenic factors may have caused small magnitude earthquake and seismic activity,” Gahalaut told Mongabay-India.
As an example, he said, excessive mining, geothermal pumps, construction of dams, and injecting water under high pressure in oil reserves to crack the area in order to release fluid and oil may “trigger” seismic activity. A research paper , ‘ Influence of anthropogenic groundwater unloading in Indo-Gangetic plains on the April 25, 2015 Mw 7.8 Nepal Earthquake ’—of which Gahalaut is a co-author—talks along similar lines. “Tectonic process and anthropogenic factors are two very different things, but like the last straw on the camel’s back, when the pressure is already high and in a critical position, human activity can trigger an earthquake,” Gahalaut said.
Mitigating vulnerabilities
For northeast India and for Assam which is in the highest probability zone in terms of earthquake hazard, the vulnerability quotient is high and increasing. “Construction on hills, mushrooming high-rises increase the vulnerability factor,” Tripathi of ASDMA told Mongabay-India, “The way to mitigate this vulnerability is to ensure all construction follow the seismic code of safety and making people aware of safety measures,” he said.
Whether every building in Assam and in particular Guwahati — “especially the new ones,” said an expert — is following the code, however, is questionable.
“There is no strong supervisory mechanism or regulatory policy to ensure that this code is followed in all construction,” Tripathi said.
Mahanta suggests that “high-resolution, micro zonation-based planning and building design following the correct seismic code” is the key to building safety which is crucial in a place like Assam. A 2007 seismic microzonation atlas of Guwahati region is a case in point.
Interestingly, the tremor also brought into limelight the good-old, single-storeyed ‘Assam-type’ houses which were built with indigenous material and were more capable of resisting earthquakes. Fast disappearing from urban areas, the jolt has revved up nostalgia on social media and has spurred conversations around the restoration of such ancestral houses.
Banner image: Seismic activity has a role to play in adding sediment load to the Brahmaputra river. Photo by VINOYBLOG/Wikimedia Commons.
Special series
Wetland champions.
- [Commentary] Wetland champions: Promise from the grassroots
- The story of Jakkur lake sets an example for inclusive rejuvenation projects
- Welcome to Tsomgo lake: Please don’t litter
- Managing waste to save the wetlands of Himachal Pradesh

Environment And Health
- Hopscotch to heat watch: How climate change is impacting summer play
- What’s killing the buzz? A look into urban fumigation
- Air pollution deaths spotlight need for health-based air quality standards
- As cities become megacities, their lanes are losing green cover

Almost Famous Species
- Biologists turn content creators to teach Indians about native biodiversity, ethically
- [Podcast] Wild Frequencies: Find Them
- A Ladakhi podcast spurs conversations about wildlife and conservation
- New study puts spotlight on neglected mammal, bird pollinators

- A blooming tale of transformation
- [Video] Flowers of worship sow seeds of sustainability
- Rising above the waters with musk melon
- Saving India’s wild ‘unicorns’

India's Iconic Landscapes
- [Explainer] How does habitat fragmentation impact India’s biodiversity hotspots?
- Unchecked shrimp farming transforms land use in the Sundarbans
- [Commentary] Complexities of freshwater availability and tourism growth in Lakshadweep
- Majuli’s shrinking wetlands and their fight for survival

Beyond Protected Areas
- Uttarakhand forests burn while fire guards face outstanding salaries and lack of resources
- Does size matter? How leopards on forest fringes choose livestock kill
- The feral elephants of the Andaman Islands

Conserving Agro-biodiversity
- [Commentary] Green Credit Rules: Death by trees?
- High temperatures lead to decline in coconut production, spiked prices
- Kashmiri willow steps up to the crease and swings for recognition
- Rising temperatures alter insect-crop interactions and impact agricultural productivity

Just Transitions
- Slow progress hinders Bihar’s solar street light initiative
- Uttar Pradesh to fast-track biofuel production with the right blend of ethanol and biogas
- [Interview] “This is in honour of adivasis fighting for their land, water, forest,” says Goldman Prize winner Alok Shukla
- How unplanned coal mine closures in India are affecting dependent communities, especially women

Thank you for visiting nature.com. You are using a browser version with limited support for CSS. To obtain the best experience, we recommend you use a more up to date browser (or turn off compatibility mode in Internet Explorer). In the meantime, to ensure continued support, we are displaying the site without styles and JavaScript.
- View all journals
- Explore content
- About the journal
- Publish with us
- Sign up for alerts
- Open access
- Published: 08 April 2024
Landslide hazard cascades can trigger earthquakes
- Zhen Zhang ORCID: orcid.org/0000-0002-1739-1234 1 ,
- Min Liu 1 ,
- Yen Joe Tan ORCID: orcid.org/0000-0001-6377-7886 1 ,
- Fabian Walter 2 ,
- Siming He 3 ,
- Małgorzata Chmiel ORCID: orcid.org/0000-0002-5573-9801 2 , 4 &
- Jinrong Su 5
Nature Communications volume 15 , Article number: 2878 ( 2024 ) Cite this article
5522 Accesses
3 Citations
1 Altmetric
Metrics details
- Natural hazards
While earthquakes are well-known to trigger surface hazards and initiate hazard cascades, whether surface hazards can instead trigger earthquakes remains underexplored. In 2018, two landslides on the Tibetan plateau created landslide-dammed lakes which subsequently breached and caused catastrophic outburst floods. Here we build an earthquake catalog using machine-learning and cross-correlation-based methods which shows there was a statistically significant increase in earthquake activity (local magnitude ≤ 2.6) as the landslide-dammed lake approached peak water level which returned to the background level after dam breach. We further find that ~90% of the seismicity occurred where Coulomb stress increased due to the combined effect of direct loading and pore pressure diffusion. The close spatial and temporal correlation between the calculated Coulomb stress increase and earthquake activity suggests that the earthquakes were triggered by these landslide hazard cascades. Finally, our Coulomb stress modeling considering the properties of landslide-dammed lakes and reservoir-induced earthquakes globally suggests that earthquake triggering by landslide-dammed lakes and similar structures may be a ubiquitous phenomenon. Therefore, we propose that earthquake-surface hazard interaction can include bidirectional triggering which should be properly accounted for during geological hazard assessment and management in mountainous regions.
Developments in understanding seismicity triggered by hydraulic fracturing

A comprehensive suite of earthquake catalogues for the 2016-2017 Central Italy seismic sequence

Complex rupture dynamics of the extremely shallow August 2020 M5.1 Sparta, North Carolina earthquake
Introduction.
Mass movements such as landslides, avalanches, and debris flows are regarded as both major hazards and key forms of geomorphic evolution in mountainous regions 1 , 2 , 3 . These surface processes can be triggered by many factors including rainfall 4 , 5 , snow melt 6 , 7 , and human activities 8 , 9 . In seismically active regions, the risk is also heightened since large earthquakes can induce widespread mass wasting with devastating effects 10 , 11 . When these mass movements block rivers and form landslide-dammed lakes (LDLs), subsequent dam breaches may cause catastrophic outburst floods which significantly increase the degree and scope of the disaster 12 , 13 . For example, the 1933 M7.5 Diexi earthquake in the eastern Tibetan plateau directly caused ~7000 fatalities and triggered many large landslides, some of which dammed rivers. These LDLs breached in the following days, generating catastrophic outburst floods which then resulted in >2500 additional fatalities 14 . Therefore, the response of surface processes to earthquakes has been studied extensively, in particular the failure mechanisms of earthquake-triggered landslides 11 , 12 , the quantification and prediction of the spatial distribution of mass movements 13 , 15 , and the geomorphic evolution after earthquakes in mountainous areas 16 , 17 , to improve our ability to mitigate the impact of these complex hazard cascades.
To date, studies about the interaction between earthquakes and mass movements have focused mainly on how earthquakes trigger mass movements and initiate hazard cascades, while a potential earthquake response to mass movements and their hazard cascades has received less attention. However, various studies have shown that processes which change the stress state of the Earth’s crust by surface loading and/or fluid diffusion 18 , 19 , such as earth tides 20 , water storage behind dams 21 , hydraulic fracturing 22 , waste fluid disposal 23 , and lake filling 24 , 25 , 26 , 27 can trigger/induce earthquakes when the stress increase on neighboring active faults exceeds a critical threshold 28 , 29 . Since hazardous mass movements and their complex hazard cascades are often accompanied by sediment redistributions and changes in water storage and associated surface loads 3 , 13 , it is conceivable that the resulting stress changes can trigger earthquakes 30 , 31 , 32 , 33 . This would have important implications for hazard management in seismically active mountain regions.
Here, we use the 2018 Baige landslide hazard cascades (Fig. 1 ) on the Tibetan plateau as a case study to investigate earthquake triggering by LDLs. We quantify the spatiotemporal evolution of seismicity and stress changes on a surrounding fault system due to this hazard cascade. We further use Coulomb stress modeling based on a global LDL database to explore the potential for LDLs to trigger earthquakes.

a Distribution of seismic stations operating since January 2014 (black triangles) and May 2018 (cyan triangles). Red box marks the specific study region where we developed the earthquake catalog. b Seismicity map from January 2014 to January 2023 (gray filled circles) showing strike-slip focal mechanisms (red/white circles) available from the National Earthquake Data Center 39 plus earthquakes that occurred during the week (10 to 16 November 2018) when the second landslide-dammed lake (LDL) reached peak water level (red filled circles). Red box marks the region shown in ( d ). c Magnitude-frequency distribution of earthquakes from May 2018 to January 2023 within 10 km of the LDLs. Magnitude of completeness (Mc) and a - and b -values were calculated using the ZMAP software 40 . d Distribution of earthquakes from May 2018 to January 2023 (gray filled circles) within 10 km of the LDLs plus earthquakes that occurred during the week (10 to 16 November 2018) when the second LDL reached peak water level (red filled circles).
2018 Baige hazard cascades
At 22:05 China Standard Time (CST) on 10 October 2018, a massive landslide occurred at the Baige village on the Tibetan plateau 34 , 35 , 36 , 37 , 38 (Fig. 1 and S 1 ) and deposited 2.5 × 10 7 m 3 of sediments into the Jinsha River 35 . This created a landslide dam with ~1500 m length, >450 m width, and ~60 m height 35 , 36 , 37 (Fig. S 1 ). With an upstream inflow of 1680 m 3 /s (ref. 35 ), the water level of the LDL gradually increased from ~2880 m asl to a peak of ~2932 m asl at 00:45 CST on 13 October (Fig. 2c ), corresponding to inundation up to ~45 km upstream and a peak volume of ~2.9 × 10 8 m 3 (refs. 35 , 36 , 37 ). As the water naturally overflowed the west of the dam, the landslide dam breached rapidly. The outburst flood’s discharge reached a peak of 10,000 m 3 /s at 06:00 CST on 13 October while the LDL’s water level rapidly decreased. Eight hours later at 14:00 CST, the discharge was reduced to that of the upstream lake inflow. However, due to the residual dam, the water level upstream of the dam (~2893 m asl) remained higher than before the landslide.

a Spatial distribution of Coulomb stress change (∆CFS) at depth of 4.5 km corresponding to −0.5 km asl on 13 November 2018 and earthquakes from 10 to 16 November 2018 (green filled circles) within 10 km of the landslide-dammed lakes (LDLs). ∆CFS is from the combined effect of direct gravitational loading and pore pressure diffusion (Fig. 2d). b Cumulative number of earthquakes with local magnitudes greater than or equal to the magnitude of completeness (Mc = 1.1) and weekly seismicity rate over a 5-year period with timings of the two 2018 Baige landslides (black arrows). Gray bar marks the period shown in ( c and d ). c Earthquake magnitudes and measured LDL water level 36 , 37 over a fifty-day period. Gray dashed line marks Mc. d Temporal evolution of ∆CFS at point P ( a ).
About three weeks later at 17:40 CST on 3 November 2018, materials at the trailing edge of the first landslide’s scar suddenly failed and the resulting landslide deposited an additional 8.7 × 10 6 m 3 of sediments on the residual dam formed by the first landslide 35 , 36 , 37 . This formed a new >96 m high landslide dam and a new LDL 35 , 36 , 37 . To mitigate the potential impact of another outburst flood, the Chinese government trenched an artificial spillway of 220 m length, 15 m depth, and >3 m width on the west side of the dam 36 , 37 . Water entered the spillway at 04:45 CST on 12 November marking the initiation of a second outburst flood and the LDL reached a peak water level of 2957 m asl at 13:40 CST on 13 November (Fig. 2c ), corresponding to inundation up to ~70 km upstream and a peak volume of ~5.8 × 10 8 m 3 . At 18:00 CST on 13 November, the outburst flood’s discharge reached a maximum of 31,000 m 3 /s (refs. 35 , 36 , 37 ). Fourteen hours later at 08:00 CST on 14 November, the discharge decreased to the upstream inflow of ~600 m 3 /s. Like for the first LDL outburst, the water level upstream of the dam (2906 m asl) remained higher than before the landslide due to the residual dam (Fig. 2c ).
Seismicity rate increase after Baige LDLs’ formation
Using continuous seismic data recorded by 13 nearby seismic stations from January 2014 to January 2023, we apply machine-learning and cross-correlation-based methods to build an earthquake catalog which contains ~3970 earthquakes with documented magnitude within a region of ~1° \(\times\) 1° (Fig. 1b ). 244 of these earthquakes within 10 km of the LDLs occurred after May 2018 when a denser seismic network began operation. It is well-established that earthquakes can trigger surface hazards and initiate hazard cascades 5 , 6 , 7 , 12 . However, the Baige landslides were not triggered by earthquakes 34 , 35 , 36 , 37 , 38 as no earthquakes with magnitude M L \(\ge\) 3.5 were recorded within 50 km in the 3 preceding years 39 (Figs. 1 and 2 ). Instead, in the week (10 to 16 November) when the second LDL approached its peak water level, 61 earthquakes with local magnitude up to ~2.6 occurred within 10 km of the LDLs.
As the second LDL approached peak water level, the number and magnitude of earthquakes started increasing as the water level rised and then peaked together with the water level peak (Fig. 2 and S 2 ). Subsequently, as the LDL water level decreased following the dam breach, the earthquake activity gradually decreased back to the background rate. 45 of the 61 events in this earthquake sequence occurred before the largest magnitude (M L 2.6) earthquake, and other M L > 2.6 earthquakes during our observation period all had fewer than 4 aftershocks in the following week (Fig. S 3 ). Therefore, this earthquake sequence is unlikely to be primarily an aftershock sequence of the largest magnitude event. We further verified that only 5 earthquakes (all with M L < 2.0) occurred within 60 km of the LDLs besides this earthquake sequence as the second LDL approached peak water level (Fig. 1b ), and the largest earthquake that occurred within 60 km of the LDLs in the 6 months before this earthquake sequence has M L 2.7 (Fig. S 4 ). Therefore, the earthquake sequence within 10 km of the LDLs is unlikely to have been triggered by surrounding large earthquakes.
We estimate the magnitude of completeness (Mc) to be 1.1 (ref. 40 ; Fig. 1c ) for the earthquakes within 10 km of the LDLs. There are 62 earthquakes between May 2018 and January 2023 with local magnitude M L \(\ge\) 1.1, 16 of which occurred in the week when the second LDL approached its peak water (Table S1 ). We then perform declustering using the Reasenberg method 41 , leaving us with 54 events (Fig S 5 ), 9 of which occurred in the week the second LDL approached its peak water level (Fig. S 5 , Table S1 ). In comparison, there were only 8 earthquakes in the previous 27 weeks (seismicity rate of ~0.3 events/week) and 37 earthquakes in the subsequent ~224 weeks (seismicity rate of ~0.2 events/week) in this region (Table S1 ). For each of \(\ge\) Mc and declustered catalogs, we consistently find that the increase in seismicity rate is statistically significant at a > 99% level based on both the statistic P (ref. 42 ) and statistic Z (ref. 43 ) tests (Methods). We further confirm that the increase in seismicity rate is also statistically significant at a >99% level (Table S1 ) based on both the improved statistic based on Poisson probability 44 and an empirically derived statistic 45 (Fig. S 6 ) tests (Methods) which were developed to determine statistically significant changes in earthquake rate under small background rate. Hence, the significant increase in seismicity rate starting when the second LDL approached peak water level (Fig. 2 and S 2 ) suggests that the two are related.
Stress changes caused by Baige LDLs
We further investigate whether the LDLs could have triggered the earthquakes by modeling the Coulomb failure stress changes (∆CFS) on the surrounding fault systems. In our study region, there are three local faults Boluo-Tongmai, Jinshajiang, and Gangtuo-Yidun faults (from west to east) with similar surface traces of ~N50°W (ref. 46 ; Fig. 1a ) though the exact fault dip and slip directions are unknown. Nevertheless, since January 2014, four M > 3.5 earthquakes occurred at distances between 16 and 35 km from the LDLs and have similar left-lateral strike-slip focal mechanisms with strikes that are also ~N50°W and dips of ~75°NE (ref. 39 ; Fig. 1a ). In addition, we find that the first motions recorded by surrounding seismic station of the two largest earthquakes (M L 2.6 and 1.9) as the second LDL approached peak water level are generally consistent with the left-lateral strike-slip focal mechanisms of these surrounding large earthquakes (Fig. S 7 ). Therefore, we take these as our receiver fault geometry for the ∆CFS modeling (Methods). Furthermore, the receiver faults are assumed to be planar and located at 4.5 km depth which is deeper than 95% of our observed seismicity (Fig. S 8 ) and corresponds to ~−0.5 km asl because ~80% of our study area is at elevation between 4 and 5 km asl 35 .
We find that as the LDLs’ water level increased following the landslides, the ∆CFS in the seismic region generally increased due to both the direct gravitational loading of the LDL and pore pressure diffusion, while ∆CFS decreased when the LDLs’ water level decreased following the dam breaches (Fig. 2 and S 9 ). The larger and longer-lasting LDL generated greater ∆CFS. The ∆CFS due to the first, smaller, and shorter-duration LDL peaked at 0.007 MPa which is smaller than the stress increase of >0.01 MPa typically associated with stress triggering of earthquakes (refs. 47 , 48 ; Fig. 2d ). This could explain why there was no significant increase in seismicity rate associated with the first LDL’s formation (Fig. 2c ). In comparison, about 3 weeks later on 3 November, the second landslide formed a larger LDL. The ∆CFS due to this second LDL peaked at 0.024 MPa when the LDL’s water level approached its peak, coinciding with maximum earthquake activity (Fig. 2c ). Although the subsequent dam breach lowered the LDL’s water level which decreased the ∆CFS due to direct gravitational loading, the pore pressure diffusion effect kept the ∆CFS elevated which might explain why earthquake activity continued over the next few days (Fig. 2c ).
While direct loading resulted in a decrease in ∆CFS directly below the LDL, it resulted in a slight increase in ∆CFS in surrounding regions (Fig. S 9a ). On the other hand, fluid diffusion significantly increased the pore pressure around the LDL, and the ∆CFS in regions closer to the LDL were larger (Fig. S 9b ). Therefore, due to the combined effect of direct loading and pore pressure diffusion, the ∆CFS around the LDL increased, especially on its east side. We find that ~90% of the earthquakes locate within regions of positive ∆CFS (Fig. 2a ). The close spatial and temporal correlation between the calculated positive ∆CFS and the statistically significant increase in earthquake activity suggest that the earthquakes were likely triggered by the LDL.
Earthquake triggering by LDLs
Considering the fundamental mechanism of earthquake triggering by LDLs and reservoir-induced earthquakes is similar, we further explore the potential for other LDLs to trigger earthquakes. Based on HiQuake, currently the most complete and up-to-date freely available database of ~226 cases of reservoir-induced earthquakes spanning the period 1933-2019 globally 49 , we find that the minimum and median heights of ~190 reservoirs with documented height that induced earthquakes are ~13 and 110 m, respectively (Fig. 3a ). In comparison, from a global database of ~410 LDLs with dams >1 million m 3 in volume reported worldwide spanning the period 1900–2018 (ref. 50 ), we find that of the ~300 LDLs with documented dam height, ~73% and ~10% were higher than the minimum and median heights of reservoirs which induced earthquakes, respectively (Fig. 3a ). Therefore, some LDLs globally are of similar heights as reservoirs which induced earthquakes.

a Frequency distribution and cumulative distribution functions of the height of reservoirs documented to have induced earthquakes 49 and landslide-dammed lakes 50 worldwide. b Frequency distribution and cumulative distribution function of the duration of landslide-dammed lakes worldwide 50 . c Temporal evolution of ∆CFS and pore pressure at point P ( d ) for a 30-m deep LDL. d Spatial distribution of ∆CFS at depth of 4.5 km corresponding to −0.5 km asl, 11 days after the formation of a 30-m deep LDL. ∆CFS is from the combined effect of direct gravitational loading and pore pressure diffusion.
We further calculate the stress response of surrounding faults in our study area to an LDL with a depth of 30 m which is the median dam height in the global LDL database 50 (Fig. 3b ). In this case, the ∆CFS at a given point (Figs. 2 a and 3d ) would exceed 0.01 MPa after ~11 days due to direct loading and pore pressure diffusion if the dam does not breach (Fig. 3c ). The stress responses to this typical LDL at different sites can vary (Fig. 3d ) and depend on factors such as the fault types 51 (Fig. S 10 ), geometries (Fig. S 11 ), and depths (Fig. S 11 ). Nevertheless, our modeling shows that both the fault types and geometries primarily affect stress distribution rather than amplitude of ∆CFS (Figs. S 10 and S 11 ), and stress changes caused by the LDLs are larger at shallower depths (Fig. S 11 ). Considering ~64% of the ~145 LDLs in the global database with documented duration lasted more than 11 days before dam breach (Fig. 3b ) with no correlation with dam height (Fig. S 12 ), our modeling suggests that other LDLs globally have the potential to trigger earthquakes if there are critically stressed faults nearby.
While gravitational loading can cause Coulomb stress to decrease in some areas, pore pressure always causes an increase in ΔCFS with its amplitude gradually decreasing away from the LDLs (Fig. S 9 ). For earthquakes that occurred in regions where gravitational loading resulted in a decrease in Coulomb stress, it is clear that pore pressure is the primary mechanism triggering these events, though we neglect the coupling effect between pore pressure diffusion and gravitational loading 24 , 25 , 26 , 27 . However, for those earthquakes that occurred in regions where gravitational loading resulted in an increase in Coulomb stresses, both gravitational loading and pore pressure may jointly control the triggered seismicity. After the second LDL formed, while the water level rises and seismicity begins to occur from 10 to 13 November (Fig. S 2 ), the relative contribution to ΔCFS of gravitational loading decreases gradually from 0.45 to 0.41 (Fig. S 13 ). Subsequently, after the dam breached on 13 November which is the day of peak seismicity rate, the water level rapidly decreased and the relative contribution to ΔCFS of gravitational loading decreases sharply from 0.41 to 0.19 so pore pressure becomes the dominant triggering mechanism. However, the relative contribution to ∆CFS of pore pressure depends on the assumed hydraulic diffusivity (Fig. S 14 ). In addition, since the pore pressure diffusion is from a long winding river (LDLs) instead of a point source, the seismicity do not display obvious migration pattern with time (Fig. S 15 ).
The region surrounding the 2018 Baige LDLs is seismically not very active which allowed us to identify the sudden, sharp increase in earthquake activity and link it to the LDLs. However, this might explain why the number and magnitude of triggered earthquakes are relatively small since earthquake triggering also depends on other factors such as the availability of critically stressed faults. Since cases of reservoir-induced earthquakes are relatively common and have included M > 7 earthquakes 49 , LDLs in seismically more active regions can potentially trigger more and larger earthquakes, assuming they increase ∆CFS given the fault locations and orientations. For example, the 2008 M7.9 Wenchuan earthquake triggered more than 100,000 landslides and formed a few hundred LDLs 52 , 53 , 54 . Some landslides were >30 times larger than our landslides 53 and the largest LDL lasted for ~1 month and reached a maximum depth of ~82 m before breaching 54 . Therefore, we suggest that such LDLs have greater potential to trigger earthquakes and the earthquake-surface interaction could even form a feedback loop (Fig. 4 ). Furthermore, while reservoir planning aims to avoid seismically active regions, ~20% of LDLs are estimated to have formed by earthquake-triggered mass wasting 50 . Consequently, earthquake triggering by LDLs might be a ubiquitous phenomenon in seismically active regions though at least to some extent, this effect may be masked by earthquake-earthquake triggering in such regions 55 .

Previous studies 5 , 6 , 13 , 16 had shown that earthquakes can trigger landslides which can block rivers and form landslide-dammed lakes. We show that direct gravitational loading and pore pressure diffusion from landslide-dammed lakes can in turn increase stresses on surrounding faults and trigger earthquakes. The interaction between these hazards is thus bidirectional.
While we only demonstrated earthquake triggering by LDLs, other surface hazards may similarly alter the stress state of surrounding faults and trigger earthquakes. For example, glacial lakes whose volumes are increasing due to climate change 56 can alter the stress state of surrounding faults through both direct gravitational loading and pore pressure diffusion. Therefore, our results suggest that such bidirectional interaction between surface hazards and earthquakes should be properly accounted for in future risk assessment of geological hazards and hazard management in mountainous regions.
Earthquake catalog building
We adopt an AI-based workflow to develop a new earthquake catalog from 2014 to 2023 based on the 13 permanent seismic stations 57 (Fig. 1 ). We first use the machine-learning-based detector, PhaseNet 58 , to identify P- and S-wave arrival times from the continuous waveforms. Subsequently, these P- and S-wave arrival times are associated into individual earthquakes using a high-throughput seismic phase associator, PyOcto 59 , and a local 1-D velocity model 60 . A threshold of at least two P picks, one S pick, and a total of five P and S picks is adopted during the PyOcto association, resulting in 6692 earthquakes within a region of 2.5° × 3° (latitude: 30° to 32.5°; longitude: 97° to 100°). We then manually inspect the waveforms of 859 earthquakes around our target area (latitude: 30.7° to 31.7°; longitude: 98.1° to 99.2°) to exclude 112 non-tectonic or unreasonably associated events. We then use the absolute location method Hypoinverse 61 to further refine the hypocenters of the remaining 747 events and calculate their location uncertainties.
We also estimate the local magnitudes for all retained earthquakes based on their S-wave amplitudes and a recently improved national standard magnitude scale that is specific to the Sichuan region, China 62 , 63 . The maximum amplitudes of horizontal component waveforms are measured after deconvolving the instrument response from the raw waveforms and then convolving the obtained signal with the theoretical Wood–Anderson seismometer response. The measured waveform window starts 0.5 s before the P wave arrival and is twice the predicted S–P travel time in length. Note that we only estimate magnitudes for 669 events with at least two stations having signal-noise ratios of S waves larger than 3. The estimated magnitudes range from M L 0.1 to 4.2.
To further improve the magnitude of completeness, we use a template matching technique, Graphics Processing Unit-based match and locate technique (GPU-M&L) 64 , to detect and locate more earthquakes based on the 669 retained earthquakes with estimated magnitude. P- and S-waves of these events are simultaneously used in GPU-M&L. The length of template window is 6 s starting 1 s before the P- and S-wave arrivals picked by PhaseNet. We filter the continuous and template waveforms from 2 to 8 Hz. The 1-D velocity model used in the above absolute earthquake location was adopted in GPU-M&L as well. Note that in GPU-M&L, we relocate the epicenters of detections through a grid search method with searching space 1.2 × 1.2 km in the horizontal direction and searching interval of 0.06 km if template and continuous waveforms were recorded by at least three seismic stations. Otherwise, the locations of detections will be defined as that of the templates. By manually inspecting these detections, the detection threshold is defined as correlation coefficient of 0.3 and 12 times median absolute deviation (MAD) if the common component number between template and continuous waveforms is \(\ge\) 9. Otherwise, the detection threshold is defined as correlation coefficient of 0.5 and 15 times MAD. In total, GPU-M&L resulted in 4294 detections including the 669 template events. The magnitudes of the newly detected earthquakes are estimated based on the local magnitudes of the templates and the amplitude ratio between these detections and their corresponding templates 65 . Note that due to the poor local seismic station coverage with available data before May 2018, 22 earthquakes that occurred from March 2014 to May 2018 in the routine catalog, which utilized data from the entire China, were not detected. Thus, these missing earthquakes are manually added to our earthquake catalog.
Declustering and seismicity rate change analysis
Using the approach from Reasenberg 41 , we identified 5 clusters of earthquakes containing a total of 13 events (5 main earthquakes and 8 foreshocks/aftershocks) out of 62 events which occurred over ~5 years, using the following input parameters 41 : look-ahead time from 0.5 to 3 days, confidence probability of 0.9, effective min magnitude cutoff of 1.1, the increase in lower cutoff magnitude during clusters of 0, and the number of crack radii surrounding each earthquake of 5.
We then evaluate the statistical significance of the observed seismicity rate change based on statistic P (ref. 42 ) and statistic Z (ref. 43 ). The statistic Z is defined as follows:
Where N and M represent the number of earthquakes after and before an event in time windows \(\triangle {t}_{N}\) and \(\triangle {t}_{M}\) , respectively. When N and M are sufficiently large and in the null hypothesis of no seismicity rate change, Z follows a Gaussian distribution with zero mean and unit standard deviation. Statistic Z was first proposed by Habermann 43 to evaluate the statistical significance of seismicity rate changes. After declustering, there were 9 earthquakes in the week (10 to 16 November) when the second LDL approached its peak water level. There were only 8 earthquakes in the previous 6 months (~27 weeks) which translates to a seismicity rate of 0.3 events/week. Based on Eq. 1 , we obtain a Z value of 2.90 taking N , M , \(\triangle {t}_{N}\) , and \(\triangle {t}_{M}\) as 9, 8, 1, and 27, respectively. A change is considered statistically significant if \(\left|Z\right|\) > 2 (ref. 43 ), and our observed seismicity rate increase after declustering 41 is statistically significant at a 99.62% level based on statistic Z .
In the null hypothesis that the seismicity rate in the week after (Poisson process with mean rate \({\lambda }_{N}\) ) and the week before (Poisson process with mean rate \({\lambda }_{M}\) ) an event is the same, the statistic P reads:
Where \(\varGamma \left(n,x\right)={\int\nolimits_{\!\!0}^{x}}{e}^{-t}{t}^{n-1}{dt}\) is the incomplete Gamma function and follows a uniform distribution between 0 and 1 (ref. 42 ). 1- P gives us the probability that an observed value could be obtained by chance if the null hypothesis of no rate change is true 42 . While there were no earthquakes in the ~1 month before the second LDL, we still take the seismicity rate for the week before the second LDL approached its peak water level as 0.3 events/week based on the average seismicity rate in the previous 6 months to be conservative. Based on Eq. 2 , we obtain a P value of 0.9982 taking N and M as 9 and 0.3, respectively. This implies that the probability that our observed seismicity rate increase occurred by random chance is 0.18%. Therefore, our observed seismicity rate increase after declustering 41 is statistically significant at a >99.82% level based on statistic P .
We further evaluate the statistical significance of the observed seismicity rate change based on both an improved statistic based on Poisson probability 44 and an empirically derived statistic 45 which were developed to determine statistically significant changes in earthquake rate under small background rate. We assumed that earthquakes occur independently at a constant rate, following a Poissonian distribution 44 . To determine the statistical significance of seismicity rate increase, we compare the number of expected earthquakes in a 1-week window to the number of earthquakes in the 1-week window after the trigger and calculate the Poisson probability of obtaining the number of earthquakes ( \(\nu\) ) in the 1-week window after the trigger given the expected number of events ( \(\mu\) ) in the 1-week window.
For this case of low background seismicity rate, similar to the idea of ref. 44 , we conservatively regard the largest number of earthquakes (3) in a 1-week window over our observation period, except for this earthquake sequence, as the expected number of events ( \(\mu\) ) in a 1-week window. Based on Eq. 3 , we obtain a P value of 0.0027 taking \(\mu\) and \(\nu\) as 3 and 9, respectively. This implies that our observed seismicity rate increase after declustering 41 is statistically significant at a >99.73% level.
We also use the empirical statistical method of ref. 45 to determine the significance in the seismicity rate change. First, we count the number of earthquakes in each 1-week time window incorporating a 1-day sliding window. There are >1700 windows from May 2018 to January 2023. We then assign the number of earthquakes N count within each window to a timestamp at the start of the window. We next build a histogram of N count values (Fig. S 6 ). Finally, using percentile measurements, the >99% statistically significant level is 3 earthquakes in a 1-week window. We observed 9 earthquakes (after declustering) as the second LDL approached the peak water level, hence this seismicity rate increase is statistically significant at a >99% level.
We also tested the impact of different input parameters on the declustering based on the approach from Reasenberg 41 . We identified 4 clusters of earthquakes containing a total of 16 events (4 main earthquakes and 12 foreshocks/aftershocks) out of 62 events which occurred over ~5 years, using other suggested input parameters 41 : look-ahead time from 1 to 10 days, confidence probability of 0.95, effective min magnitude cutoff of 1.5, the increase in lower cutoff magnitude during clusters of 0.5, and the number of crack radii surrounding each earthquake of 10. While the declustered earthquake catalogs with different input parameters are different, we further confirm that this seismicity rate increase is statistically significant at a > ~90% level based on the four above statistical tests (Table S1 ).
Coulomb stress change calculation
Coulomb stress change (∆CFS) on the surrounding fault systems due to the LDL is a result of the combined effect of direct gravitational loading and pore pressure diffusion. We model ∆CFS due to both direct loading and pore pressure diffusion using the GeoTaos software 66 . Since the direct gravitational loading effect can be regarded as the result of point forces acting vertically on the surface of a homogenous elastic half-space, the loading from the LDL can be calculated by the convolution of the Green’s function and the distributed surface forces. The distributed surface forces can be estimated based on the spatiotemporal evolution of the LDL’s water level. To quantify the spatiotemporal evolution of the LDL’s water level, the LDL is mapped as a series of square cells with a size of 200 by 200 m. The elevation of each square cell is estimated from the GDEM V3 30 m. Based on the elevation of each cell, the water depth of each cell can then be estimated. Therefore, the distributed surface forces and thus the direct gravitational loading effect of each cell can be calculated using the water depth of each cell. Note that we ignore the ∆CFS resulting from gravitational loading of landslide sediments, since these landslide sediments are not a new source of mass but only the very local redistributions (~1–2 km) of sediments along the landslide sliding path.
Uncertainty analyses
Before more seismic stations became operational in May 2018, no earthquakes were detected within 10 km of the LDLs due to limited station coverage and/or low seismicity rate. Nevertheless, in the ~250 weeks of observation period since May 2018 for which we have an improved earthquake catalog, 61 earthquakes occurred within 10 km of the LDLs during the week when the second LDL’s water level almost peaked while there were only 183 earthquakes over the ~247 weeks outside the time period of the two LDLs i.e., a background seismicity rate of only ~0.7/week over ~5 years (Table S1 ). Therefore, our catalog shows that the seismicity rate during the LDL is significantly higher than the background seismicity rate of the region. We chose to focus on earthquakes that occurred within 10 km of LDLs since the region with stress increase of >0.01 MPa is always located within 10 km of the LDLs (Fig. 2a ). Nevertheless, the earthquake activity within larger and smaller regions shows a similar accelerated trend during the landslide hazard cascades (Fig. S 16 ).
As the second LDL approached peak water level, ~50% and ~95% of the hypocenters in the earthquake sequence were at depths of <1.2 and <4.5 km, respectively (Fig. S 8 ). Similarly, for the earthquake catalog before template matching, the median depth of these triggered earthquakes is ~1.2 km (Fig. S 8 ). However, the mean horizontal and vertical location uncertainties of our cataloged earthquakes are ~4 and ~8 km, respectively. To further constrain the likely depths of these events, we look at the larger earthquakes which are more accurately located since they are recorded by more stations. We find that the median depth of all M L > 1.1 earthquakes during the second LDL is ~1.5 km with average depth uncertainty of ~6 km. Our modeling shows that ∆CFS down to a depth of 7 km can reach levels that trigger earthquakes (Fig. S 11d ), and the ∆CFS is larger at shallower depths (Fig. S 11 ). Furthermore, ~60% of reservoirs with documented earthquake depths have induced earthquakes up to ~8 km depth (Fig. S 17 ). Therefore, we conclude that the earthquake sequence can be triggered by stress changes due to the LDL.
The stress change on surrounding faults due to the LDLs partly depends on the fault geometry. In contrast to the well-documented fault strike, the dip of the fault is less well constrained. We assume a fault dip of 75°NE based on the focal mechanisms of four M > 3.5 earthquakes nearby and the consistency of the first motions of the two largest earthquakes (ML 2.6 and 1.9) as the second LDL approached peak water level with these focal mechanisms (Fig. S 7 ), though we cannot confirm that the focal mechanisms of the smaller earthquakes necessarily share similar geometries. Nevertheless, our modeling shows that the fault dip mainly affects the spatial distribution and amplitude of ∆CFS but not its sign, and the seismicity generally locates within regions of positive ∆CFS for a range of different assumed fault dips (Fig. S 11e–h ). Hence, the dip uncertainty has minimal effect on our conclusion that landslide hazard cascades can trigger earthquakes.
The stress change on surrounding faults caused by LDL is also related to the fault friction coefficient and the fluid diffusion coefficient. We assumed a friction coefficient of 0.5 for our ∆CFS modeling. However, the chosen friction coefficient has minimal effect on both the spatial distribution and amplitude of ∆CFS (Fig. S 18 ). In addition, due to differences in rock properties and depth-dependent confining pressure, crustal hydraulic diffusivity has been found to range from 0.01 to 5 m 2 /s (refs. 67 , 68 ). Both the geometry and closure of faults and fractures also cause significant spatial variation in hydraulic diffusivity 69 , 70 . These factors make it challenging to obtain a precisely constrained hydraulic diffusivity for the calculation of ∆CFS. Nevertheless, higher fluid diffusivity causes the pore water pressure to increase faster, which increases the amplitude of ∆CFS over a wider area. Our chosen value of 0.3 m 2 /s is on the lower end of observed values and is a typical value observed in fluid-driven seismic swarms in different regions 71 , 72 , 73 . While hydraulic diffusivity strongly influences the time at which ∆CFS exceeds a certain threshold, we further confirm that ∆CFS exceeds 0.01 MPa for hydraulic diffusivities ranging from 0.02 to 2 m 2 /s. On the day of peak seismicity rate, the relative contribution to ∆CFS of pore pressure increases from ~0.1 to 0.9 as the assumed hydraulic diffusivity increases from 0.02 to 2 m 2 /s (Fig. S 14 ). We conclude that our main conclusion that LDLs can trigger earthquakes is robust to changes in the discussed parameter choices.
Reporting summary
Further information on research design is available in the Nature Portfolio Reporting Summary linked to this article.
Data availability
The reservoir data which induced earthquakes are available at the Human-Induced Earthquake Database (HiQuake) http://inducedearthquakes.org/ . The database for landslide-dammed lakes is available from https://doi.org/10.1016/j.earscirev.2020.103116 . The earthquake catalog produced in this study is available at https://doi.org/10.5281/zenodo.10807902 . The GDEM data are provided by ASTER https://asterweb.jpl.nasa.gov .
Code availability
The software PhaseNet 58 and PyOcto 59 used in this study are publicly available at https://doi.org/10.1093/gji/ggy423 and https://doi.org/10.26443/seismica.v3i1.1130 , respectively. The software Hypoinverse 61 and GPU-M&L 64 are publicly available at https://www.usgs.gov/software/hypoinverse-earthquake-location and https://doi.org/10.1785/0220190241 , respectively. The software Zmap 40 and GeoTaos 66 are publicly available at http://www.seismo.ethz.ch/en/research-and-teaching/products-software/software/ZMAP and http://bemlar.ism.ac.jp/lxl/Taos/Download.htm , respectively.
Allen, S. K., Rastner, P., Arora, M., Huggel, C. & Stoffel, M. Lake outburst and debris flow disaster at Kedarnath, June 2013: Hydrometeorological triggering and topographic predisposition. Landslides 13 , 1479–1491 (2016).
Article Google Scholar
Hovius, N., Stark, C. P., Tutton, M. A. & Abbott, L. D. Landslide-driven drainage network evolution in a pre-steady-state mountain belt: finisterre mountains, Papua New Guinea. Geology 26 , 1071–1074 (1998).
Article ADS Google Scholar
Korup, O. et al. Giant landslides, topography, and erosion. Earth Planet. Sci. Lett. 261 , 578–589 (2007).
Article ADS CAS Google Scholar
Segoni, S., Piciullo, L. & Gariano, S. L. A review of the recent literature on rainfall thresholds for landslide occurrence. Landslides 15 , 1483–1501 (2018).
Keefer, D. K. et al. Real-time landslide warning during heavy rainfall. Science 238 , 921–925 (1987).
Article ADS CAS PubMed Google Scholar
Moreiras, S., Lisboa, M. S. & Mastrantonio, L. The role of snow melting upon landslides in the central Argentinean Andes. Earth Surf. Process. Landf. 37 , 1106–1119 (2012).
Kawagoe, S., Kazama, S. & Sarukkalige, P. R. Assessment of snowmelt triggered landslide hazard and risk in Japan. Cold Reg. Sci. Technol. 58 , 120–129 (2009).
Bozzano, F., Cipriani, I., Mazzanti, P. & Prestininzi, A. Displacement patterns of a landslide affected by human activities: insights from ground-based InSAR monitoring. Nat. hazards 59 , 1377–1396 (2011).
Alexander, D. On the causes of landslides: human activities, perception, and natural processes. Environ. Geol. Water Sci. 20 , 165–179 (1992).
Keefer, D. K. Landslides caused by earthquakes. Geol. Soc. Am. Bull. 95 , 406–421 (1984).
Meunier, P., Hovius, N. & Haines, J. A. Topographic site effects and the location of earthquake induced landslides. Earth Planet. Sci. Lett. 275 , 221–232 (2008).
Wasowski, J., Keefer, D. K. & Lee, C. T. Toward the next generation of research on earthquake-induced landslides: current issues and future challenges. Eng. Geol. 122 , 1–8 (2011).
Kargel, J. S. et al. Geomorphic and geologic controls of geohazards induced by Nepal’s 2015 Gorkha earthquake. Science 351 , aac8353 (2016).
Article CAS PubMed Google Scholar
Ren, J. et al. Surface rupture of the 1933 M 7.5 Diexi earthquake in eastern Tibet: implications for seismogenic tectonics. Geophys. J. Int. 212 , 1627–1644 (2018).
Fan, X. et al. Earthquake‐induced chains of geologic hazards: patterns, mechanisms, and impacts. Rev. Geophys. 57 , 421–503 (2019).
Marc, O., Hovius, N., Meunier, P., Uchida, T. & Hayashi, S. I. Transient changes of landslide rates after earthquakes. Geology 43 , 883–886 (2015).
Korup, O., Densmore, A. L. & Schlunegger, F. The role of landslides in mountain range evolution. Geomorphology 120 , 77–90 (2010).
Amos, C. B. et al. Uplift and seismicity driven by groundwater depletion in central California. Nature 509 , 483–486 (2014).
Borsa, A. A., Agnew, D. C. & Cayan, D. R. Ongoing drought-induced uplift in the western United States. Science 345 , 1587–1590 (2014).
Cochran, E. S., Vidale, J. E. & Tanaka, S. Earth tides can trigger shallow thrust fault earthquakes. Science 306 , 1164–1166 (2004).
Bell, M. L. & Nur, A. Strength changes due to reservoir-induced pore pressure and stresses and application to Lake Oroville. J. Geophys. Res. Solid Earth 83 , 4469–4483 (1978).
Schultz, R., Atkinson, G., Eaton, D. W., Gu, Y. J. & Kao, H. Hydraulic fracturing volume is associated with induced earthquake productivity in the Duvernay play. Science 359 , 304–308 (2018).
Healy, J. H., Rubey, W. W., Griggs, D. T. & Raleigh, C. B. The denver earthquakes. Science 161 , 1301–1310 (1968).
Gough, D. I. & Gough, W. I. Stress and deflection in the lithosphere near Lake Kariba—I. Geophys. J. Int. 21 , 65–78 (1970).
Kebeasy, R. M. & Gharib, A. A. Active fault and water loading are important factors in triggering earthquake activity around Aswan Lake. J. Geodyn. 14 , 73–85 (1991).
Simpson, D. W., Stachnik, J. C. & Negmatoullaev, S. K. Rate of change in lake level and its impact on reservoir triggered seismicity. Bull. Seismol. Soc. Am. 108 , 2943–2954 (2018).
Hill, R. G., Weingarten, M., Rockwell, T. K. & Fialko, Y. Major southern San Andreas earthquakes modulated by lake-filling events. Nature 618 , 761–766 (2023).
Gomberg, J. & Davis, S. Stress/strain changes and triggered seismicity at The Geysers. Calif. J. Geophys. Res. Solid Earth 101 , 733–749 (1996).
Keranen, K. M., Savage, H. M., Abers, G. A. & Cochran, E. S. Potentially induced earthquakes in Oklahoma, USA: Links between wastewater injection and the 2011 Mw 5.7 earthquake sequence. Geology 41 , 699–702 (2013).
Calais, E., Freed, A. M., Van Arsdale, R. & Stein, S. Triggering of New Madrid seismicity by late-Pleistocene erosion. Nature 466 , 608–611 (2010).
Steer, P., Simoes, M., Cattin, R. & Shyu, J. B. H. Erosion influences the seismicity of active thrust faults. Nat. Commun. 5 , 5564 (2014).
Steer, P. et al. Earthquake statistics changed by typhoon-driven erosion. Sci. Rep. 10 , 10899 (2020).
Article ADS CAS PubMed PubMed Central Google Scholar
Jeandet Ribes, L., Cubas, N., Bhat, H. S. & Steer, P. The impact of large erosional events and transient normal stress changes on the seismicity of faults. Geophys. Res. Lett. 47 , e2020GL087631 (2020).
Zhang, Z. et al. Source characteristics and dynamics of the October 2018 Baige landslide revealed by broadband seismograms. Landslides 16 , 777–785 (2019).
Zhang, L., Xiao, T., He, J. & Chen, C. Erosion-based analysis of breaching of Baige landslide dams on the Jinsha River, China, in 2018. Landslides 16 , 1965–1979 (2019).
Zhong, Q., Chen, S., Wang, L. & Shan, Y. Back analysis of breaching process of Baige landslide dam. Landslides 17 , 1681–1692 (2020).
Gao, Y., Zhao, S., Deng, J., Yu, Z. & Rahman, M. Flood assessment and early warning of the reoccurrence of river blockage at the Baige landslide. J. Geogr. Sci. 31 , 1694–1712 (2021).
Chen, F. et al. Kinematic process and mechanism of the two slope failures at Baige Village in the upper reaches of the Jinsha River, China. Bull. Eng. Geol. Environ. 80 , 3475–3493 (2021).
Guo, X., Jiang, C., Han, L., Yin, H. & Zhao Z. Focal mechanism data set in Chinese mainland and its adjacent area (2009–2021). Natl. Earthquake Data Center. https://data.earthquake.cn . https://doi.org/10.12080/nedc.11.ds.2022.0004 (2022).
Wiemer, S. A software package to analyze seismicity: ZMAP. Seismol. Res. Lett. 72 , 373–382 (2001).
Reasenberg, P. Second-order moment of central California seismicity, 1969-82. J. Geophys. Res. 90 , 5479–5495 (1985).
Marsan, D. & Nalbant, S. S. Methods for measuring seismicity rate changes: a review and a study of how the Mw 7.3 landers earthquake affected the aftershock sequence of the M w 6.1 Joshua Tree earthquake. Pure Appl. Geophys. 162 , 1151–1185 (2005).
Habermann, R. Precursory seismicity patterns: stalking the mature seismic gap. Earthquake prediction. Int. Rev. 4 , 29–42 (1981).
Google Scholar
Alfaro‐Diaz, R., Velasco, A. A., Pankow, K. L. & Kilb, D. Optimally oriented remote triggering in the Coso geothermal region. J. Geophys. Res. Solid Earth 125 , e2019JB019131 (2020).
Pankow, K. L. & Kilb, D. Going beyond rate changes as the sole indicator for dynamic triggering of earthquakes. Sci. Rep. 10 , 4120 (2020).
Wu, F., Jiang, L. & Zhang, G. Discussion on quaternary activity characteristics of northern section of Jinshajiang fault zone along Sichuan-Tibet Railway. High. Speed Railw. Technol. (Chin.) 10 , 23–28 (2019).
Reasenberg, P. A. & Simpson, R. W. Response of regional seismicity to the static stress change produced by the Loma Prieta earthquake. Science 255 , 1687–1690 (1992).
Harris, R. A. Introduction to special section: Stress triggers, stress shadows, and implications for seismic hazard. J. Geophys. Res. Solid Earth 103 , 24347–24358 (1998).
Wilson, M., Foulger, G., Gluyas, J., Davies, R. & Julian, B. HiQuake: The human‐induced earthquake database. Seismol. Res. Lett. 88 , 1560–1565 (2017).
Fan, X. et al. The formation and impact of landslide dams–state of the art. Earth Sci. Rev. 203 , 103116 (2020).
King, G. C., Stein, R. S. & Lin, J. Static stress changes and the triggering of earthquakes. Bull. Seismol. Soc. Am. 84 , 935–953 (1994).
Xu, C., Xu, X., Yao, X. & Dai, F. Three (nearly) complete inventories of landslides triggered by the May 12, 2008 Wenchuan Mw 7.9 earthquake of China and their spatial distribution statistical analysis. Landslides 11 , 441–461 (2014).
Huang, R. & Li, W. Analysis of the geo-hazards triggered by the 12 May 2008 Wenchuan Earthquake, China. Bull. Eng. Geol. Environ. 68 , 363–371 (2009).
Cui, P., Zhu, Y., Han, Y., Chen, X. & Zhuang, J. The 12 May Wenchuan earthquake-induced landslide lakes: distribution and preliminary risk evaluation. Landslides 6 , 209–223 (2009).
Hill, D. P., Pollitz, F. & Newhall, C. Earthquake-volcano interactions. Phys. Today 55 , 41–47 (2002).
Shugar, D. H. et al. Rapid worldwide growth of glacial lakes since 1990. Nat. Clim. Change 10 , 939–945 (2020).
Liu, M. et al. Complexity of initiation and evolution of the 2013 Yunlong earthquake swarm. Earth Planet. Sci. Lett. 612 , 118168 (2023).
Article CAS Google Scholar
Zhu, W. & Beroza, G. C. PhaseNet: a deep-neural-network-based seismic arrival-time picking method. Geophys. J. Int. 216 , 261–273 (2019).
ADS Google Scholar
Münchmeyer, J. PyOcto: A high-throughput seismic phase associator. Seismica 3 . https://doi.org/10.26443/seismica.v3i1.1130 (2024).
Fang, L. et al. Aftershock observation and analysis of the 2013 M S 7.0 Lushan earthquake. Seismol. Res. Lett. 86 , 1135–1142 (2015).
Klein, F. W. User’s guide to HYPOINVERSE-2000, a Fortran program to solve for earthquake locations and magnitudes (No. 2002-171). US Geological Survey (2002).
Richter, C. F. An instrumental earthquake magnitude scale. Bull. Seismol. Soc. Am. 25 , 1–32 (1935).
Tang, L. et al. Comparison of the new national standard magnitude scales with the traditional magnitude scales. Acta Seismol. Sin. (Chin.) 40 , 121–131 (2018).
Liu, M., Li, H., Zhang, M. & Wang, T. Graphics processing unit‐based match and locate (GPU‐M&L): An improved match and locate method and its application. Seismol. Res. Lett. 91 , 1019–1029 (2020).
Shelly, D. R., Ellsworth, W. L. & Hill, D. P. Fluid‐faulting evolution in high definition: connecting fault structure and frequency‐magnitude variations during the 2014 Long Valley Caldera, California, earthquake swarm. J. Geophys. Res. Solid Earth 121 , 1776–1795 (2016).
Lei, X. Possible roles of the Zipingpu Reservoir in triggering the 2008 Wenchuan earthquake. J. Asian Earth Sci. 40 , 844–854 (2011).
Husen, S., Bachmann, C. & Giardini, D. Locally triggered seismicity in the central Swiss Alps following the large rainfall event of August 2005. Geophys. J. Int. 171 , 1126–1134 (2007).
Montgomery‐Brown, E., Shelly, D. R. & Hsieh, P. A. Snowmelt‐triggered earthquake swarms at the margin of Long Valley Caldera, California. Geophys. Res. Lett. 46 , 3698–3705 (2019).
Kuempel, H. Poroelasticity: parameters reviewed. Geophys. J. Int. 105 , 783–799 (1991).
Scholz, C. H. The Mechanics of Earthquakes and Faulting (Cambridge University Press, 2002).
Kitagawa, Y., Fujimori, K. & Koizumi, K. Temporal change in permeability of the Nojima fault zone by repeated water injection experiments. Tectonophysics 443 , 183–192 (2007).
Parotidis, M., Shapiro, S. A. & Rothert, E. Evidence for triggering of the Vogtland swarms 2000 by pore pressure diffusion. J. Geophys. Res. 110 , B05S10 (2005).
Hainzl, S. & Ogata, Y. Detecting fluid signals in seismicity data through statistical earthquake modeling. J. Geophys. Res. 110 , B05SS07 (2005).
Download references
Acknowledgements
We thank Jinping Zi, Peifeng Wang, and Yiyuan Zhong for valuable discussions. This work was supported by the Croucher Tak Wah Mak Innovation Award (Y.J.T.), CUHK Direct Grant for Research (Grant 4053594; Y.J.T.), CUHK Research Fellowship Scheme (Grant 4200720; Y.J.T.), CUHK Postdoctoral Fellowship Scheme (Grant 3135043; Y.J.T.), the National Key Research and Development program of China (Grant No.2022YFF0800604; S.H.), and the Major Program of the National Natural Science Foundation of China (Grant No.42090051; S.H.).
Author information
Authors and affiliations.
Earth and Environmental Sciences Programme, Faculty of Science, The Chinese University of Hong Kong, Hong Kong S.A.R., China
Zhen Zhang, Min Liu & Yen Joe Tan
Swiss Federal Institute for Forest, Snow and Landscape Research, Zürich, Switzerland
Fabian Walter & Małgorzata Chmiel
State Key Laboratory of Mountain Hazards and Engineering Safety, Institute of Mountain Hazards and Environment, Chinese Academy of Sciences, Chengdu, China
Géoazur, OCA, Campus Azur du CNRS, Sophia Antipolis, Nice, France
Małgorzata Chmiel
Earthquake Monitoring Center, Sichuan Earthquake Administration, Chengdu, China
You can also search for this author in PubMed Google Scholar
Contributions
Conceptualization: Z.Z. and Y.J.T.; Investigation: Z.Z., M.L., Y.J.T., F.W., S.H., M.C., and J.S.; Methodology: Z.Z., M.L., and Y.J.T.; Project administration: Y.J.T. and S.H.; Supervision: Y.J.T. and S.H.; Writing-original draft: Z.Z. and Y.J.T.; Writing-review and editing: Z.Z., M.L., Y.J.T., F.W., S.H., M.C., and J.S.
Corresponding authors
Correspondence to Zhen Zhang or Yen Joe Tan .
Ethics declarations
Competing interests.
The authors declare no competing interests.
Peer review
Peer review information.
Nature Communications thanks Ya-Ju Hsu, Philippe Steer and the other, anonymous, reviewer for their contribution to the peer review of this work. A peer review file is available.
Additional information
Publisher’s note Springer Nature remains neutral with regard to jurisdictional claims in published maps and institutional affiliations.
Supplementary information
Supplementary information, peer review file, reporting summary, rights and permissions.
Open Access This article is licensed under a Creative Commons Attribution 4.0 International License, which permits use, sharing, adaptation, distribution and reproduction in any medium or format, as long as you give appropriate credit to the original author(s) and the source, provide a link to the Creative Commons licence, and indicate if changes were made. The images or other third party material in this article are included in the article’s Creative Commons licence, unless indicated otherwise in a credit line to the material. If material is not included in the article’s Creative Commons licence and your intended use is not permitted by statutory regulation or exceeds the permitted use, you will need to obtain permission directly from the copyright holder. To view a copy of this licence, visit http://creativecommons.org/licenses/by/4.0/ .
Reprints and permissions
About this article
Cite this article.
Zhang, Z., Liu, M., Tan, Y.J. et al. Landslide hazard cascades can trigger earthquakes. Nat Commun 15 , 2878 (2024). https://doi.org/10.1038/s41467-024-47130-w
Download citation
Received : 31 July 2023
Accepted : 21 March 2024
Published : 08 April 2024
DOI : https://doi.org/10.1038/s41467-024-47130-w
Share this article
Anyone you share the following link with will be able to read this content:
Sorry, a shareable link is not currently available for this article.
Provided by the Springer Nature SharedIt content-sharing initiative
By submitting a comment you agree to abide by our Terms and Community Guidelines . If you find something abusive or that does not comply with our terms or guidelines please flag it as inappropriate.
Quick links
- Explore articles by subject
- Guide to authors
- Editorial policies
Sign up for the Nature Briefing newsletter — what matters in science, free to your inbox daily.

- Share full article
Advertisement
Supported by
Landslides in Southern India Kill More Than 100 People
Rescue workers struggled to reach isolated villages in the state of Kerala, where torrential rains have washed away terrain. The death toll was expected to rise.

By Sameer Yasir and Anupreeta Das
Reporting from New Delhi
At least 108 people were killed and dozens more injured in the southern Indian state of Kerala after days of heavy rainfall set off multiple landslides in a hilly region, in what government officials called one of its worst natural disasters.
The landslides in the district of Wayanad — a region whose natural, rugged beauty draws millions of tourists every year — uprooted trees, knocked down communication lines, submerged roads and washed away a bridge. Rescue operations were hindered by the region’s terrain, which made it harder to reach hundreds of residents in the areas that were hit the hardest.
“This is one of the worst natural calamities Kerala has ever witnessed,” said Pinarayi Vijayan, the chief minister of Kerala, in a statement. Mr. Vijayan said the damage to homes and livelihoods was “immense,” adding that his government had set up relief camps for thousands of people affected.
The death toll rose throughout the day as rescue workers recovered more bodies from under debris, and the number was expected to rise as the search continued, according to government officials. More than 125 people were injured.
“We are fighting nature at its worst,” said Akhilesh Kumar, an official with India’s National Disaster Response Forces who was overseeing the rescue operation along with the Indian Army and firefighters.
In his statement, Mr. Vijayan said the government was sending tankers of drinking water and rations and setting up temporary hospitals. He said there were efforts underway to identify the dead even as search teams looked for other victims of the catastrophe.
We are having trouble retrieving the article content.
Please enable JavaScript in your browser settings.
Thank you for your patience while we verify access. If you are in Reader mode please exit and log into your Times account, or subscribe for all of The Times.
Thank you for your patience while we verify access.
Already a subscriber? Log in .
Want all of The Times? Subscribe .
IMAGES
VIDEO
COMMENTS
In the first in the series, on 29 July, a 6.4 magnitude quake triggered landslides in the mountain region of the island and killed at least 16 people. Following this a shallow, magnitude 6.9 earthquake struck Lombok and Bali on August 5th, 2018, killing over 555 people, injuring 1300 and leaving at least 353000 homeless.
The strongest so far is a M w 4.7 [1] Casualties. 2 dead, 12 injured. The 2021 Assam earthquake struck 11 km (7 miles) away from Dhekiajuli, Assam, India at 07:51 (IST) on April 28, 2021 with a moment magnitude of 6.0 at 34.0 km (21.1 mi) depth. [2] [3] The quake struck with an epicenter 140 km (86 miles) north of the main city of Guwahati.
By Tim Wallace Ashley Wu and Jugal K. Patel Aug. 18, 2021. A magnitude-7.2 earthquake struck Haiti Saturday morning, killing more than 1,900 and leaving thousands injured and displaced from their ...
A building in Hualien, Taiwan, leans dangerously after a magnitude-7.4 earthquake on 3 April 2024. Credit: VCG via Getty. Scientists warn that more shocks are likely after Taiwan was rocked by the ...
Over the weekend, Haiti was hit by a magnitude 7.2 earthquake that crumbled homes and buildings and killed more than 1,200 people. Rescuers are still working to find survivors amid the rubble. The ...
Before the quake on 8 September, there was reason to believe Morocco could experience strong earthquakes. Kelman highlights a 2007 study that counted 1,739 major earthquakes — defined as greater ...
On 6 February 2023, a moment magnitude (Mw) 7.8 earthquake struck southern and central Turkey and northern and western Syria. The earthquake was the strongest in Turkey in more than 80 years ...
Most will refer to this as an earthquake, singular. But this is no singular disaster. The country has experienced more than 300 seismic events since April 25, 2015, and nearly 9000 people died as a direct result of the two most major earthquakes. For most of Nepal's approximately 30 million people, living uncertainty is old hat.
On August 7th, 2020, a magnitude Mw = 5.0 earthquake shook 5 km north of Mila city center, northeast of Algeria, causing substantial damage directly to structures, and indirectly from induced impacts of landslides and rock falls, ultimately disrupt to everyday civilian life. Given the recent significant seismic occurrences in the region, a detailed and comprehensive examination and assessment ...
Abstract and Figures. The Gorkha (Nepal) earthquake of magnitude 7.8, occurred at 11:56 NST on 25 April 2015 with an epicentre 77 km northwest of Kathmandu, the capital city of Nepal, that is home ...
Moderate-size earthquakes of about magnitude 6 have occurred on the Parkfield section of the San Andreas fault at fairly regular intervals - in 1857, 1881, 1901, 1922, 1934, and 1966. The first, in 1857, was a foreshock to the great Fort Tejon earthquake which ruptured the fault from Parkfield to the southeast for over 180 miles.
Assam's 6.4 quake exposes its vulnerabilities. A 6.4 magnitude earthquake, measured on the Richter scale, rocked Assam in the early hours of April 28 this year. Two people died of shock and there was a lot of damage to property. There were at least 20 aftershocks. Soil liquefaction, when water seeps from the ground, was seen in places near ...
A magnitude-7.8 earthquake hit southeastern Turkey and parts of Syria in the early hours of the morning of 6 February. At least 17,000 people are known to have lost their lives, with thousands ...
The recent devastating 2015 Gorkha earthquake not only caused a huge death toll but also a great economic loss. Many public and private structures including residential buildings, educational and ...
In addition, the intensity of Tongzhou area in this earthquake may be as high as XI. In the future, it may be necessary to pay attention to strengthening earthquake prevention and disaster reduction in this area. Then, we estimated the number of deaths in the study area at that time, and the mathematical expectation was of about 74,968.
of earthquakes each year. According to statistical. data, India has experienced over 22,000 earthquakes. with a magnitude of 3.5 or higher in the last 50. years. The most seismically active region ...
Abstract. Despite decades of observational, laboratory and theoretical studies, the processes leading to large earthquake generation remain enigmatic. However, recent observations provide new ...
The earthquake. The 7.8-magnitude temblor, striking in the early hours of Feb. 6, was Turkey's deadliest earthquake since 1939, when more than 30,000 people were killed, and among the deadliest ...
Rescue operations are ongoing in India's southern Kerala state on Wednesday after heavy monsoon rains triggered deadly landslides that swept through homes and stranded hundreds of people ...
Here, we use the 2018 Baige landslide hazard cascades (Fig. 1) on the Tibetan plateau as a case study to investigate earthquake triggering by LDLs. We quantify the spatiotemporal evolution of ...
In recent years, cyclones, severe flooding and torrential downpours have eroded more than 1,200 acres of its coastal land, displacing thousands of people.